Jessica Steslow
· maps and data ·
· green engineering ·

· maps and data ·
· green engineering ·
Filter by Tag:
Agroforestry Benefits Website
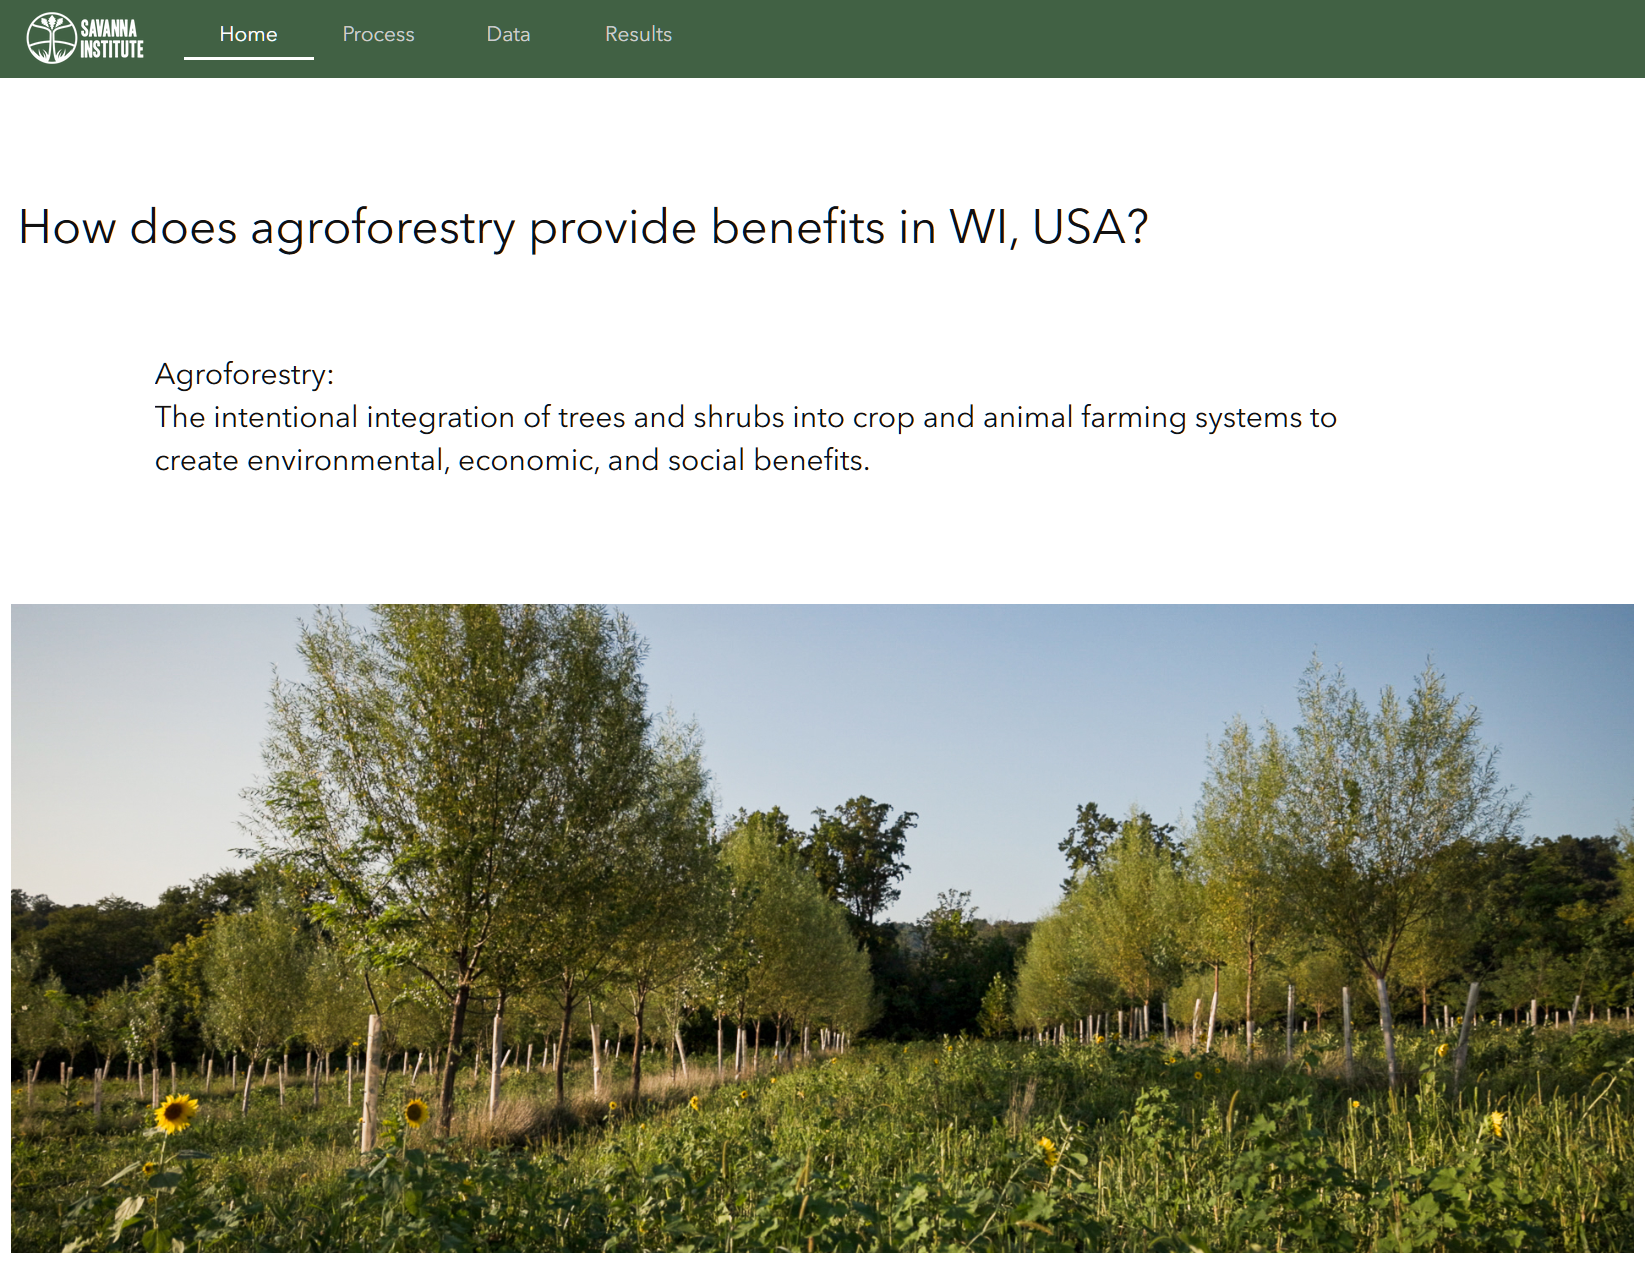
A website that explores the environmental benefits of agroforestry. Apr 2024.
Desert Museum Explorer
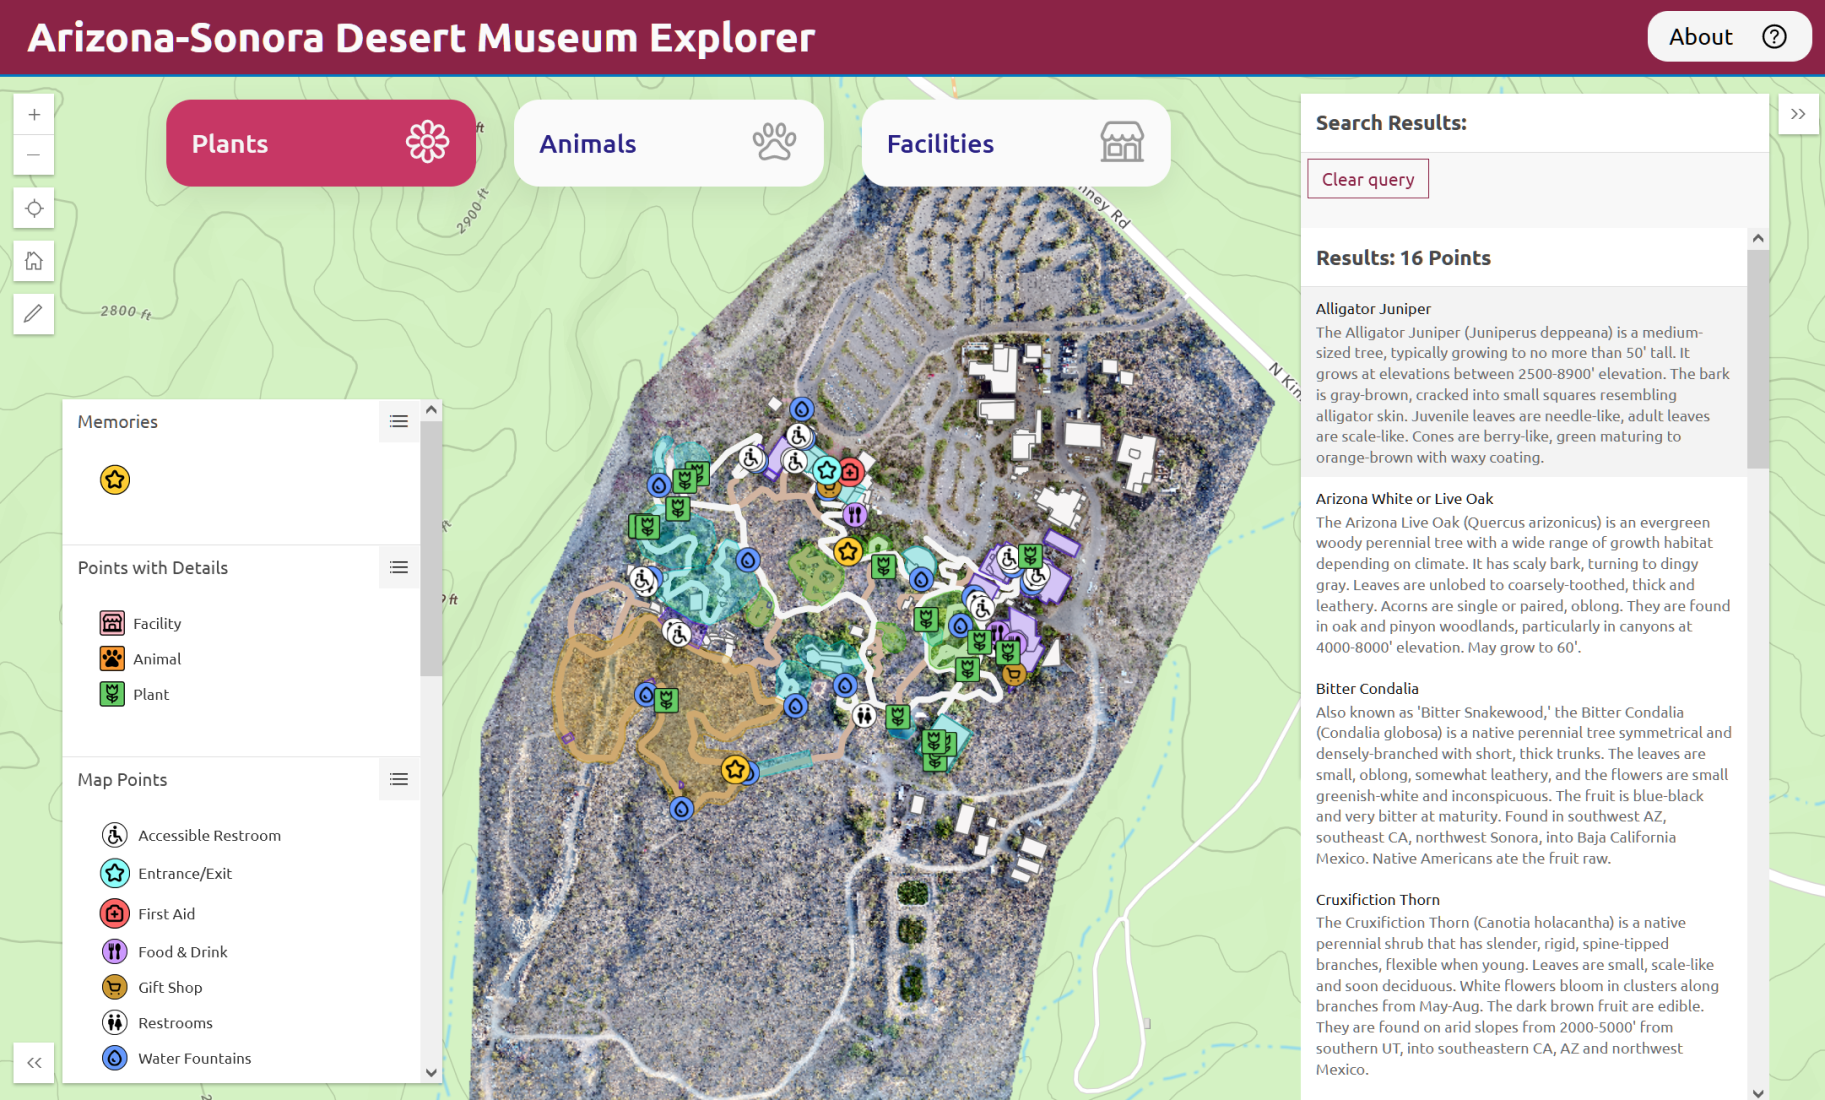
A full page interactive web map of the Desert Museum, Tucson AZ. Apr 2024.
Shiny for Python Application
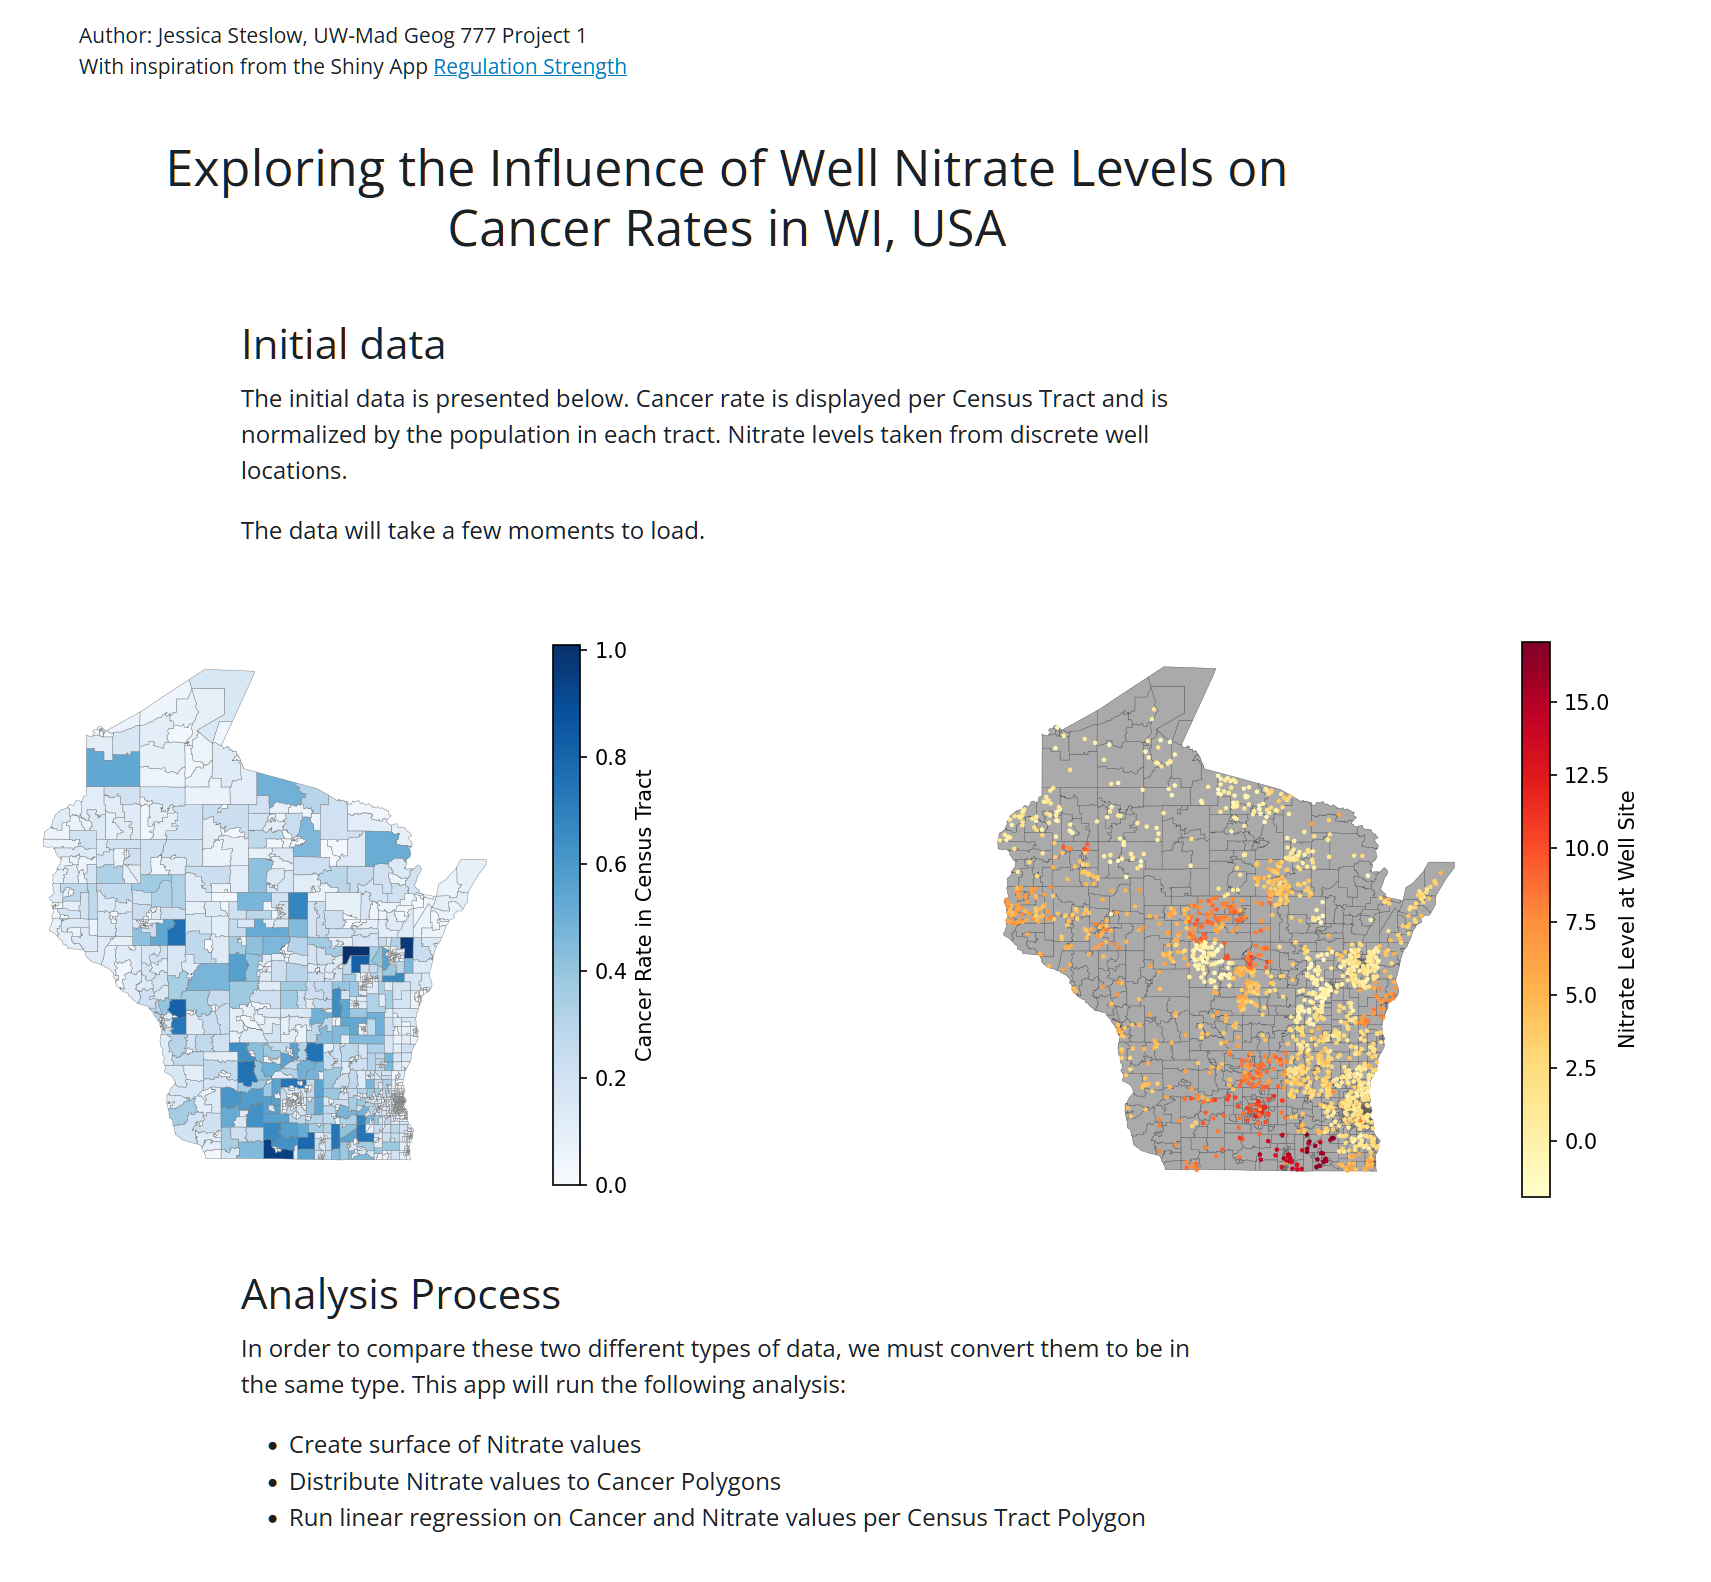
A website application that explores the relationship between nitrate level and cancer rate in WI, USA, using Shiny for Python. Mar 2024.
Madison Bike Repair Stations Web App
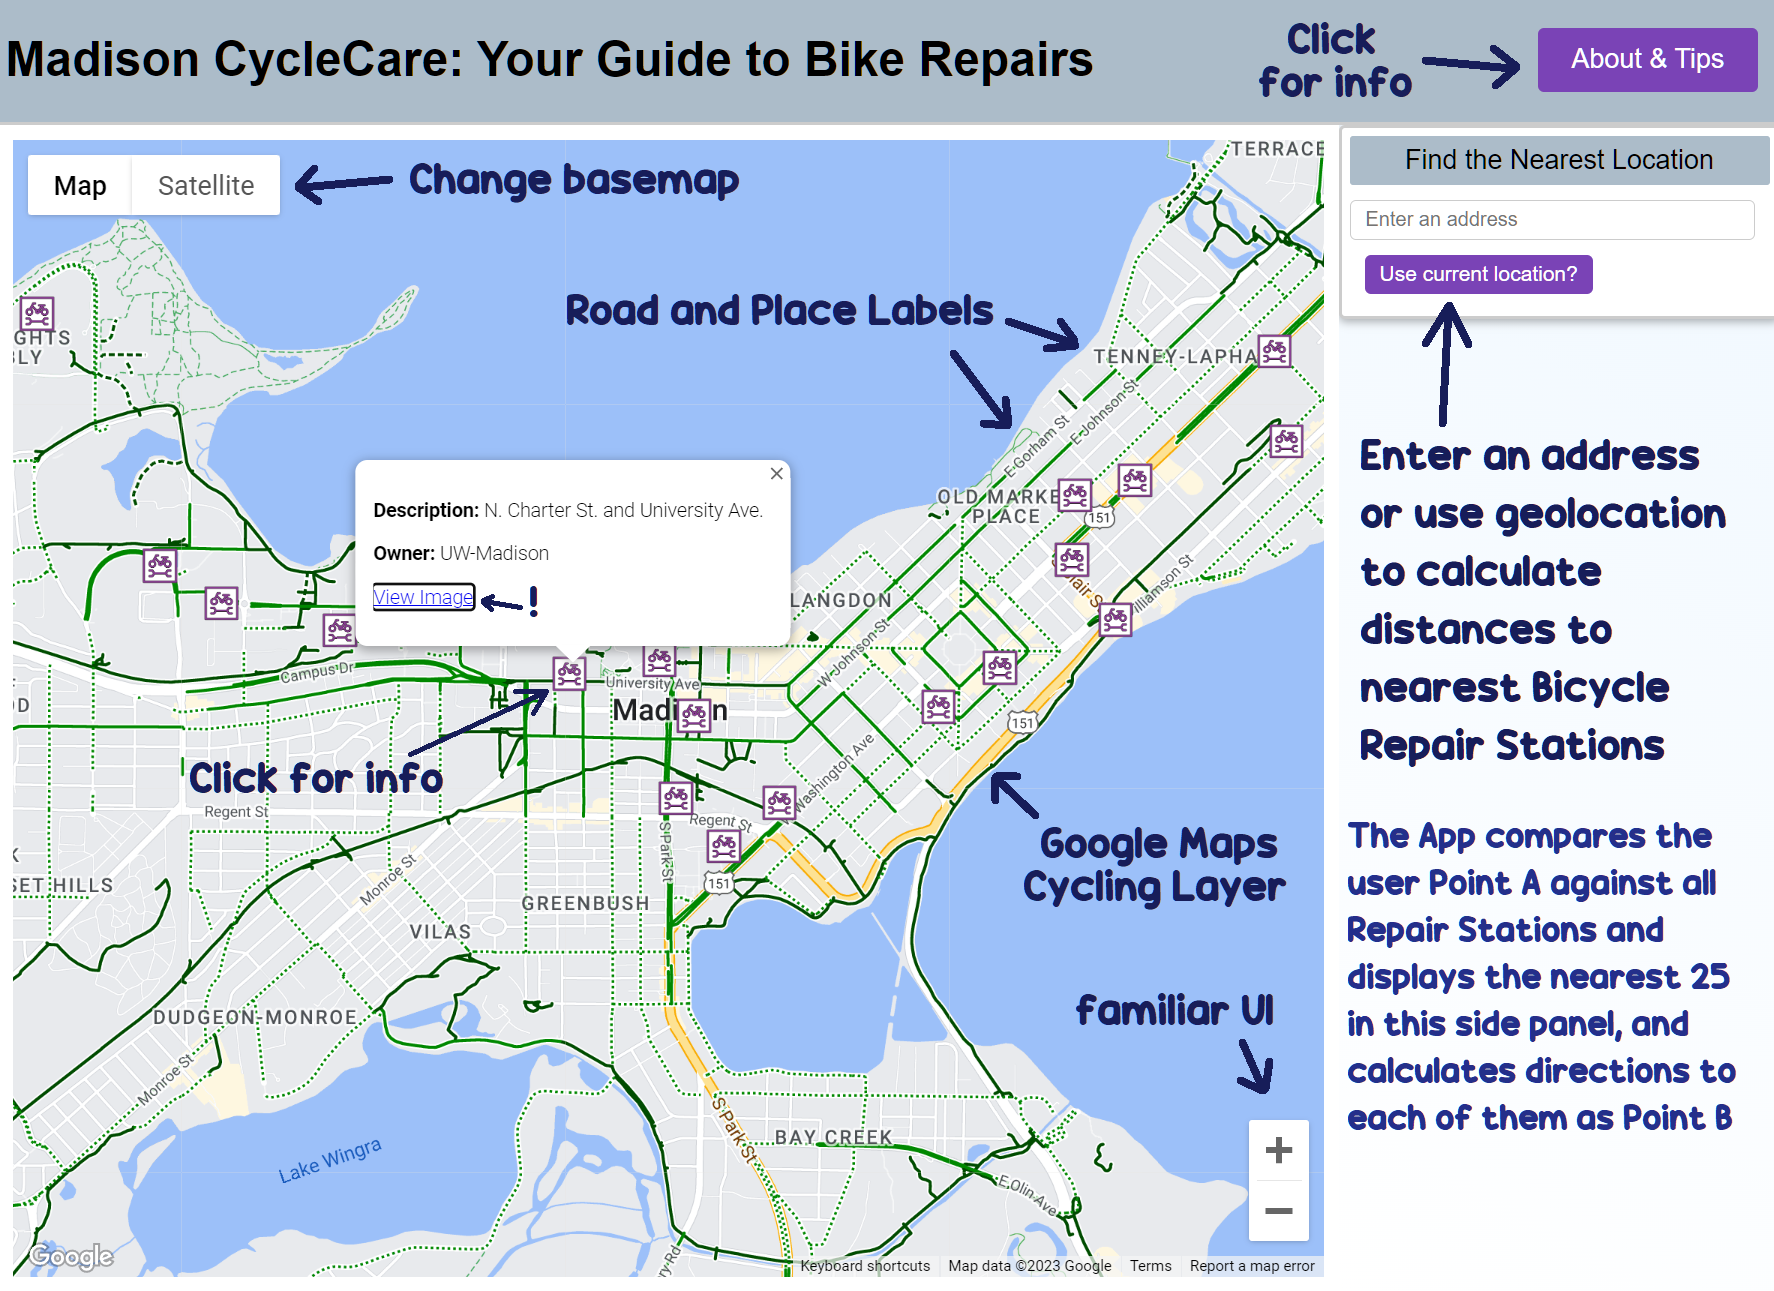
Learning back-end web development with Google Maps API. Dec 2023.
The Dragon Map Website
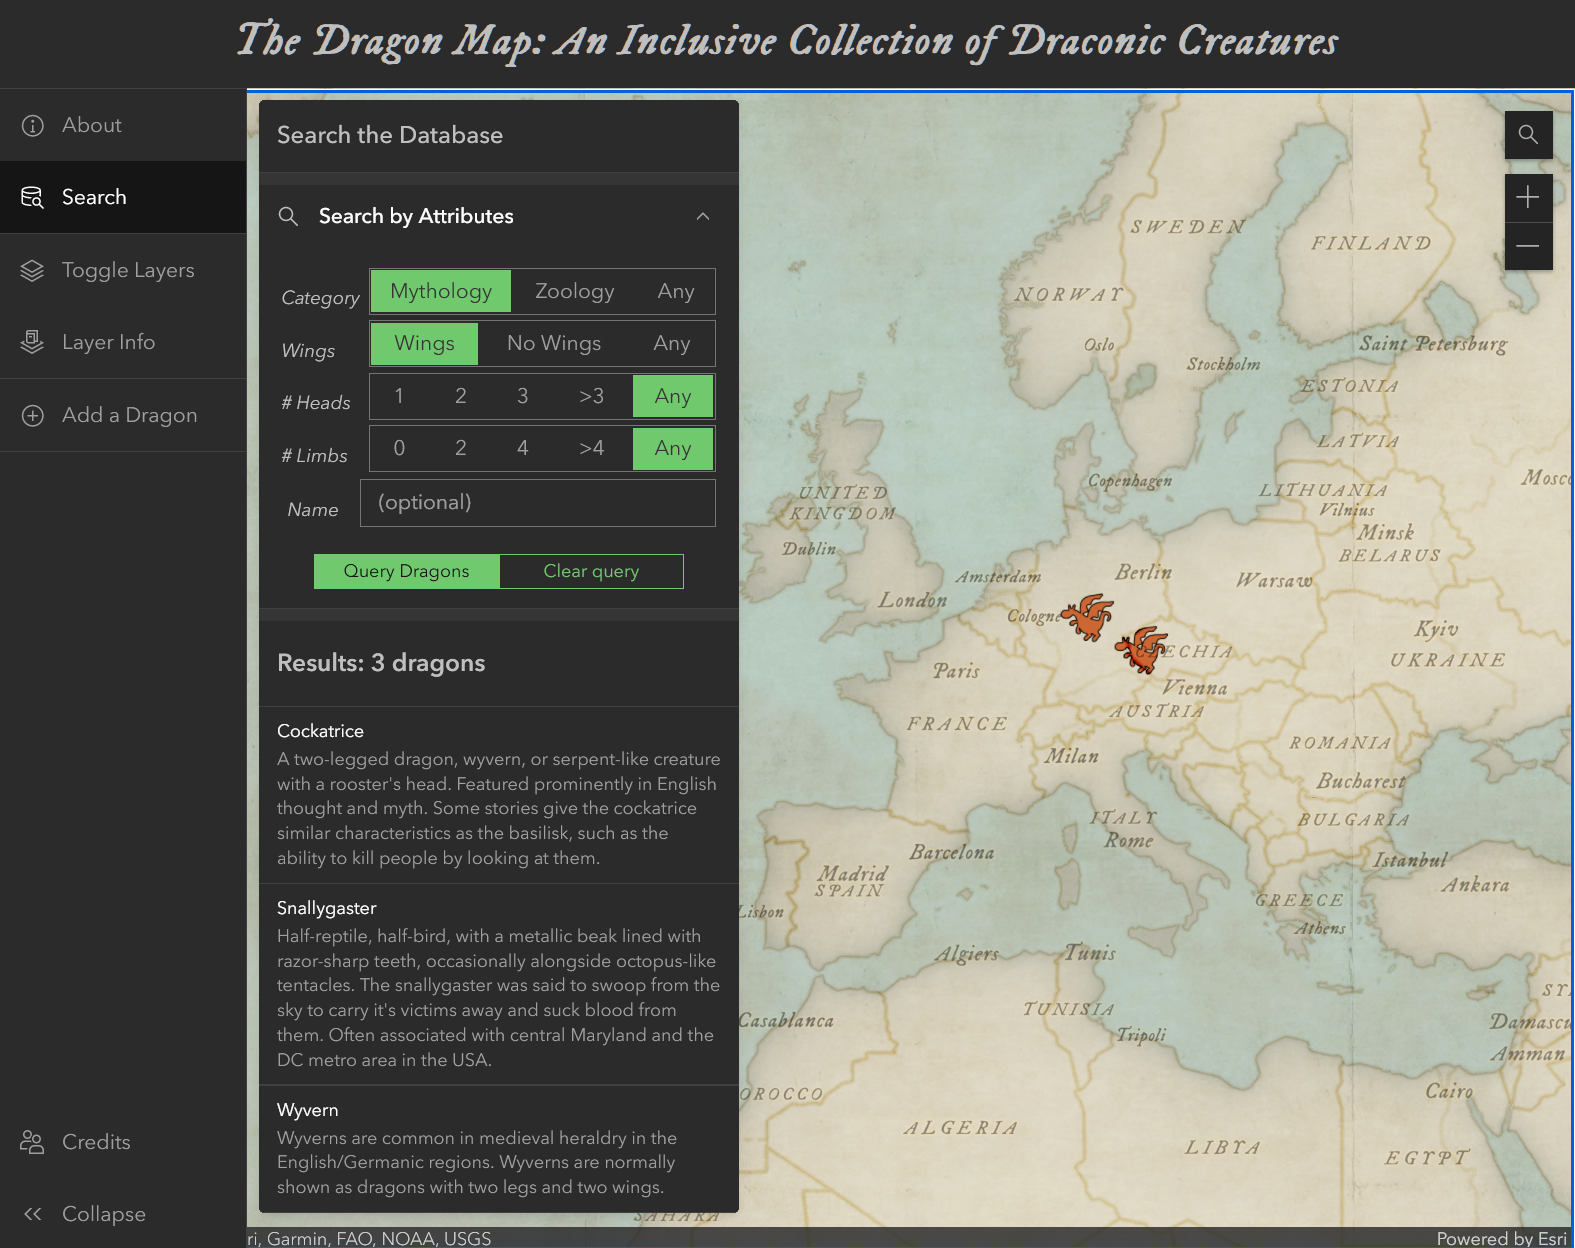
Learning ESRI's ArcGIS Maps SDK for JavaScript with a dragon database. Oct 2023.
Map of Venice Website
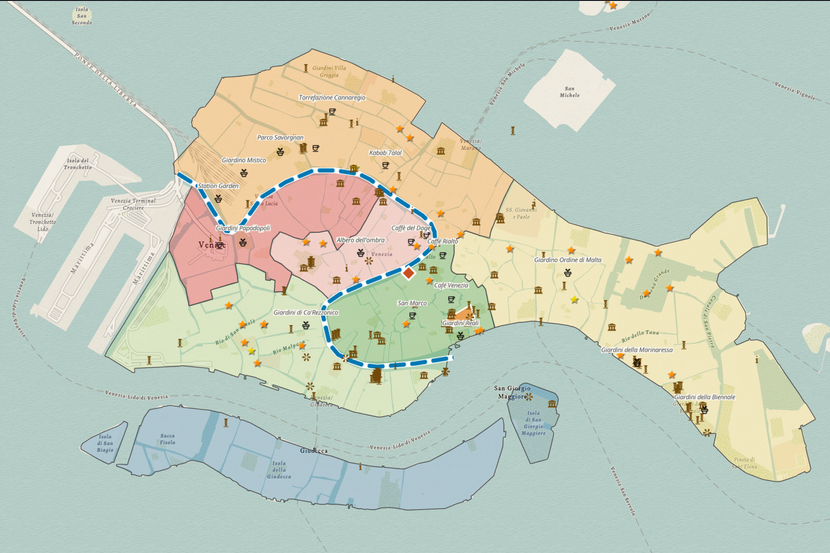
Learning ESRI's ArcGIS Maps SDK for JavaScript with a colorful map of Venice. Sep 2023.
Mississippi HydroSheds Website
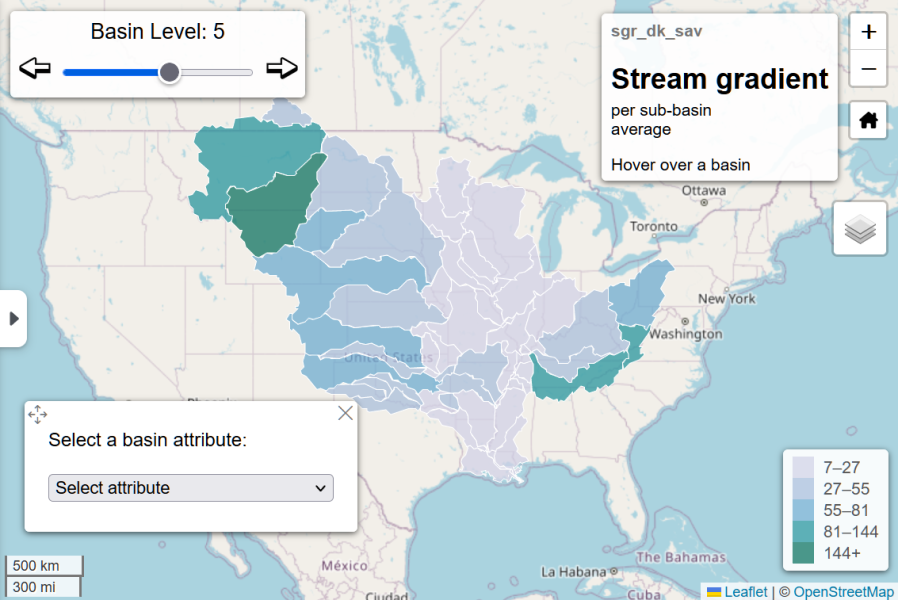
A web application to explore the various levels of watersheds of the great Mississippi River. Aug 2023.
AZ Data Viz Website
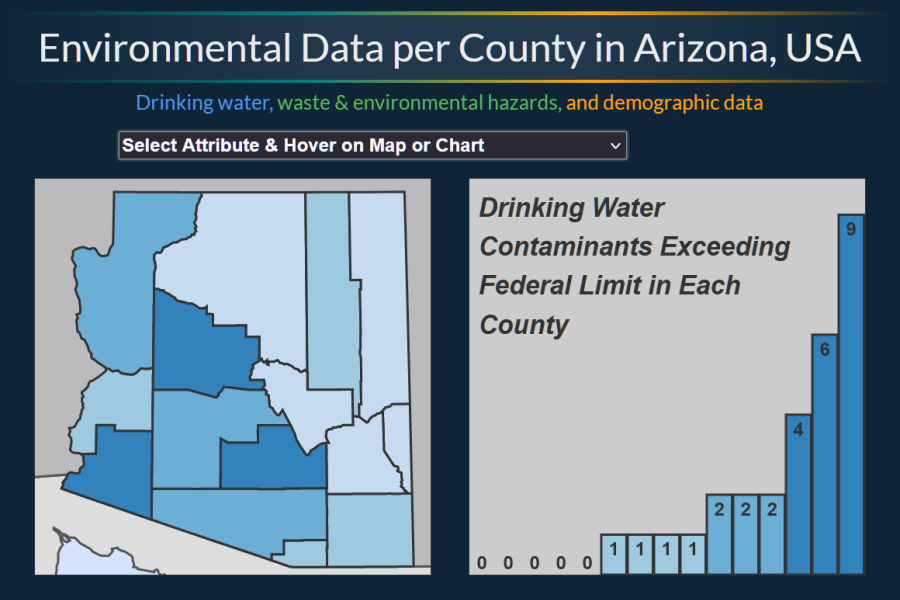
Learning linked visualizations with D3 JS with data per county in Arizona. Aug 2023.
Air Quality Index Exploration Website
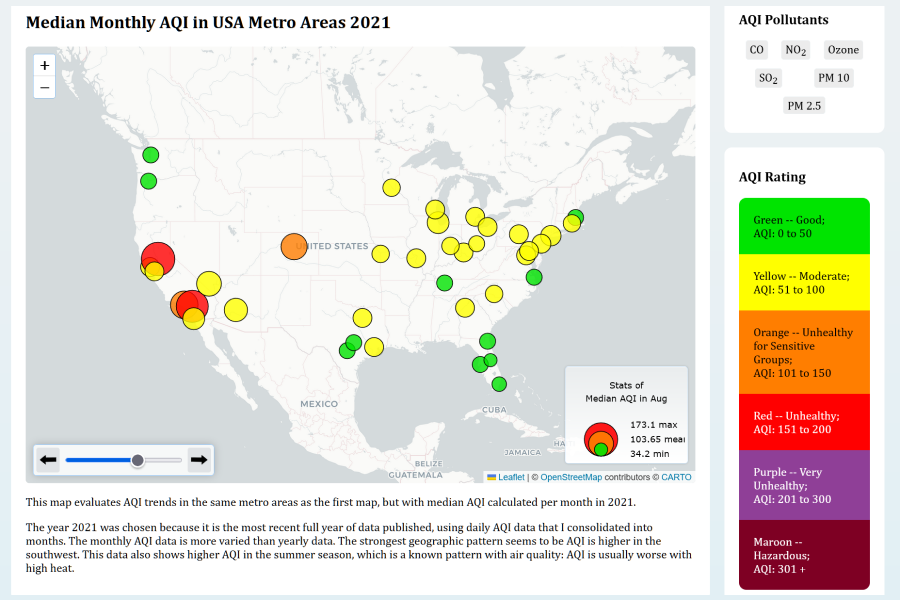
Learning JavaScript with the Leaflet JS library while exploring how air quality data changes over time. Jul 2023.
Ghibli Inspired Mapbox Theme
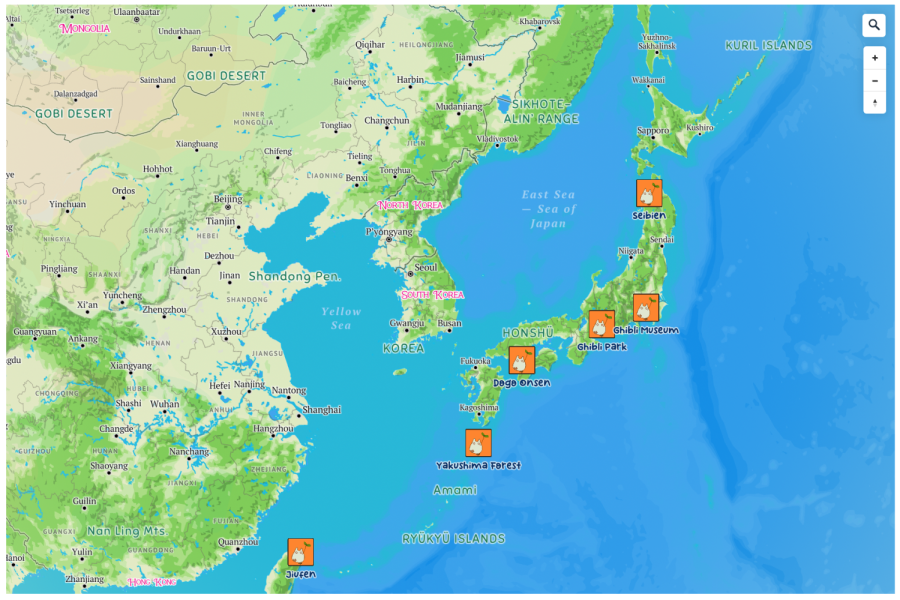
A custom theme for Mapbox Studio inspired by the animated films of Studio Ghibli. Apr 2023.
Sketchy AZ
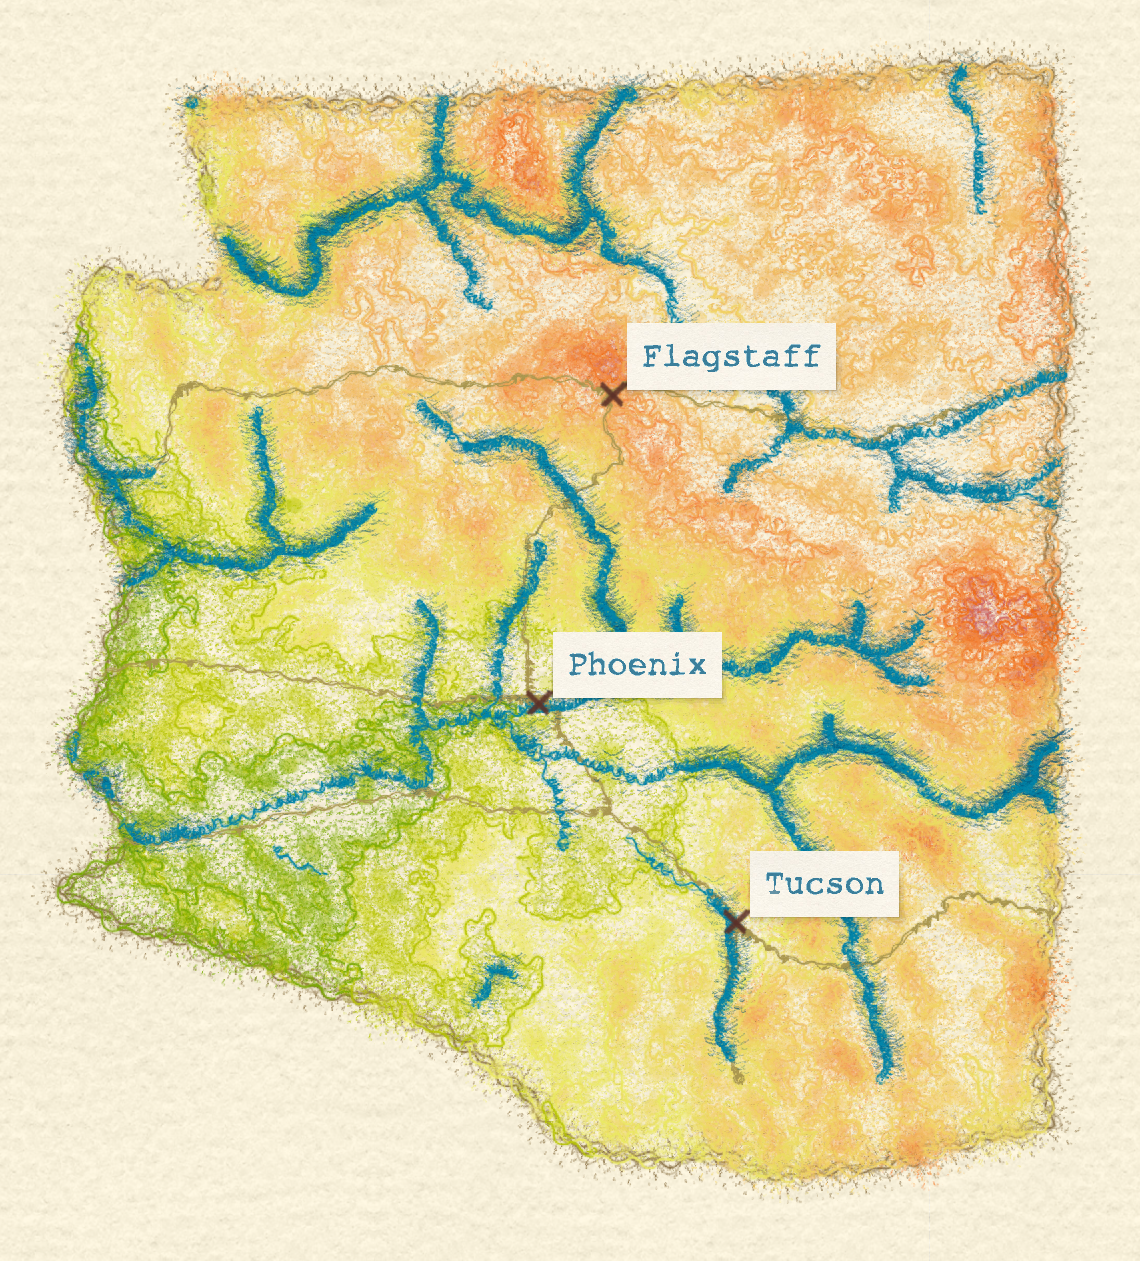
An exploration using "Sketchy" from ERSI Styles. Mar 2023.
Bridgeport Park
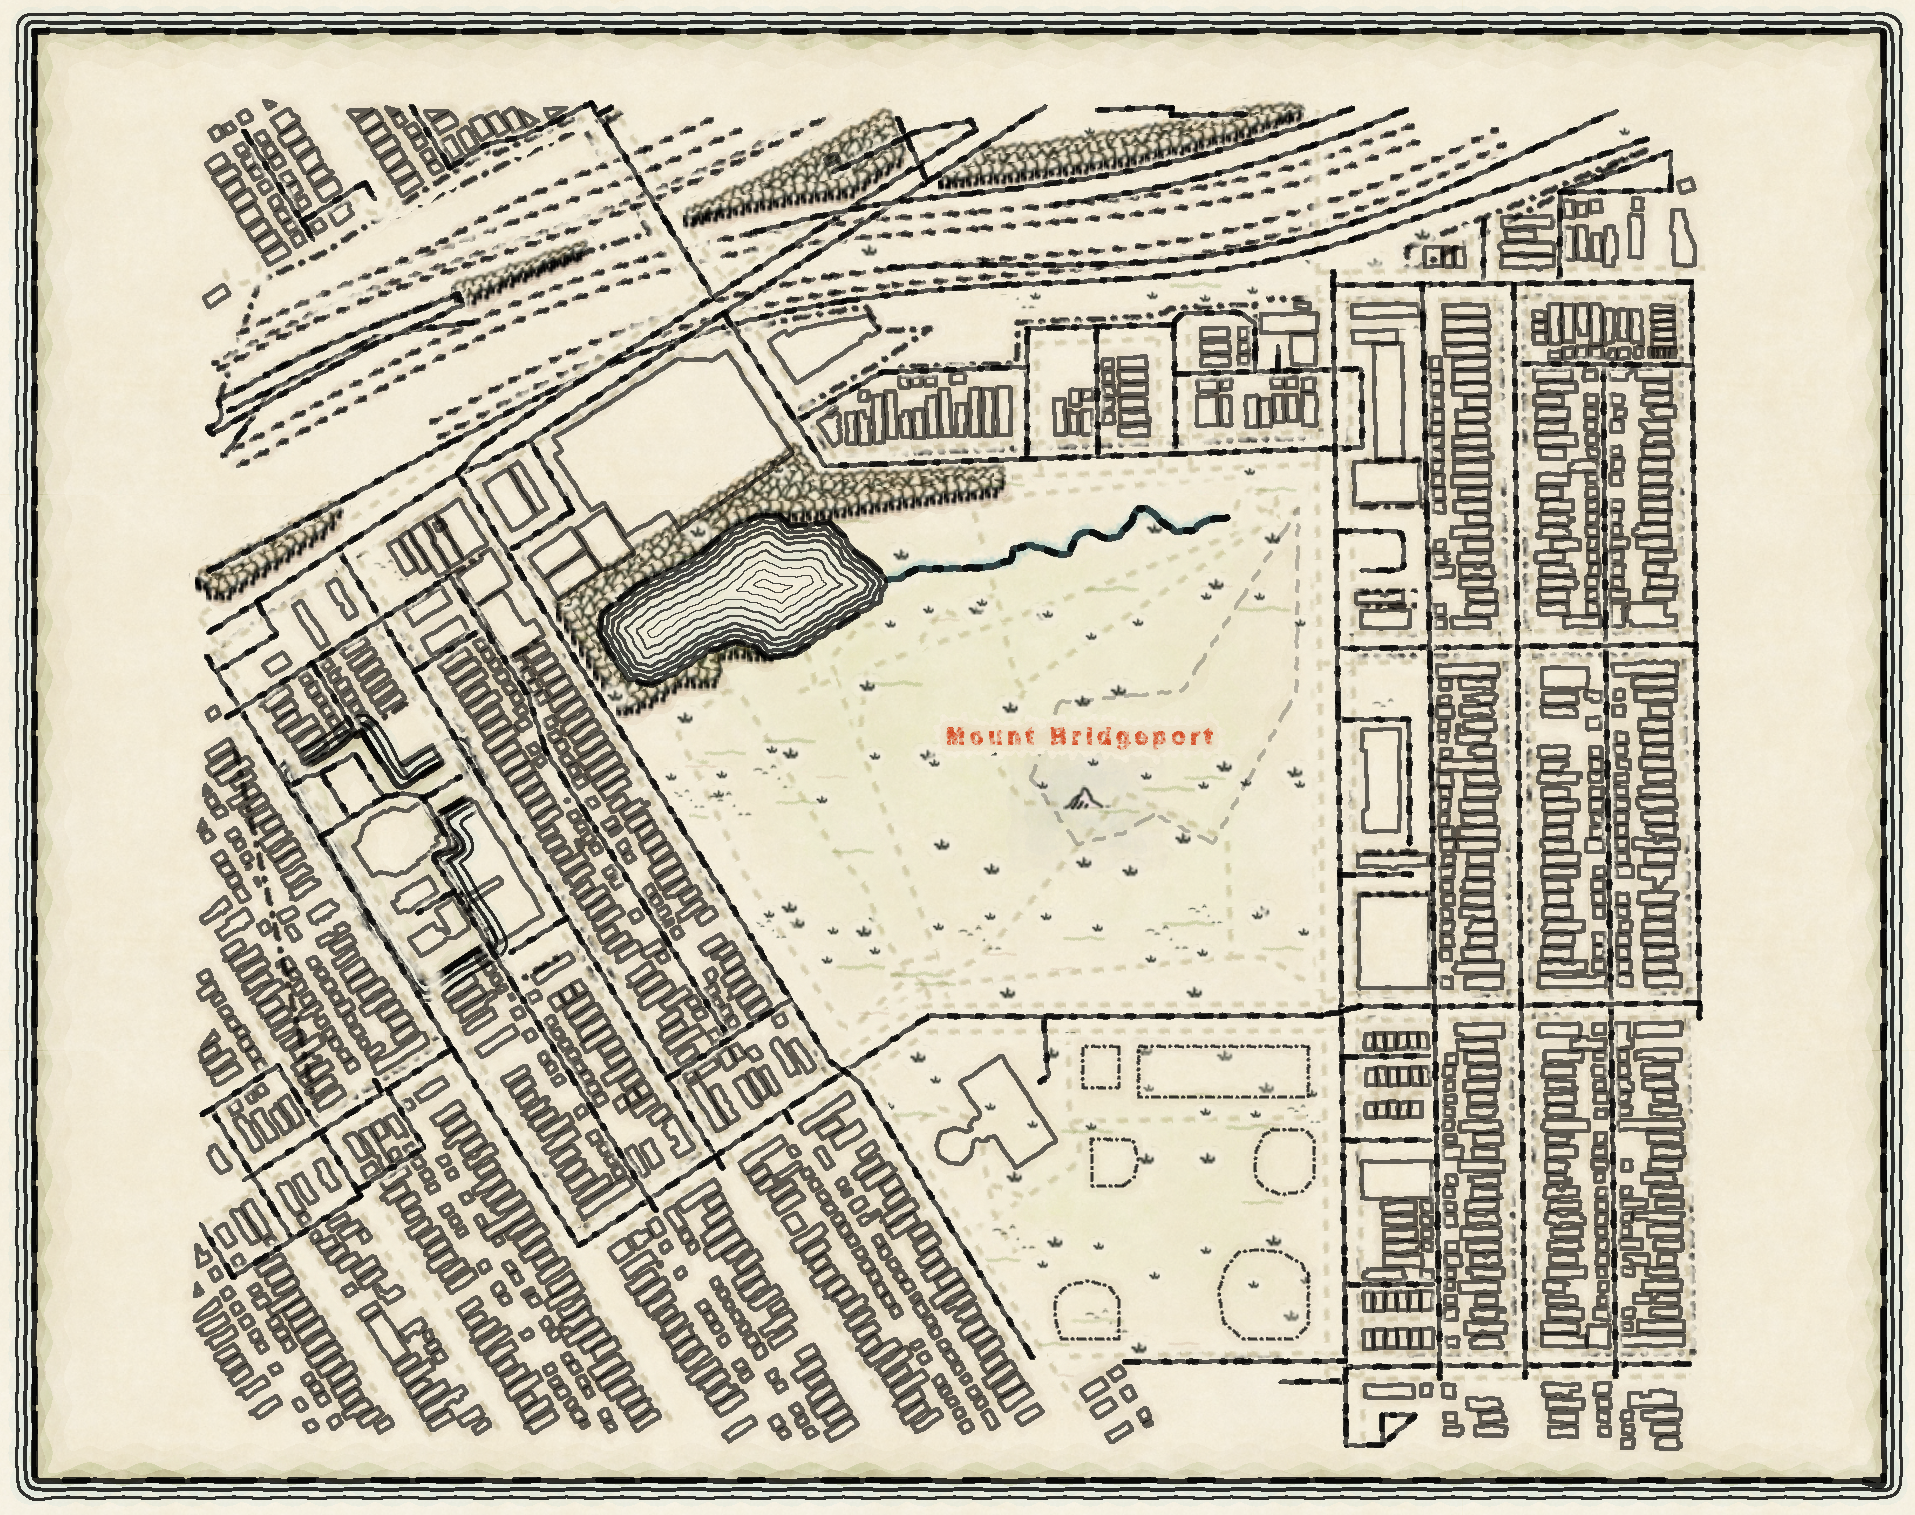
An exploration using "My Precious" from ERSI Styles. Mar 2023.
Houseplants & Fertility Rate Infographic (Preview)
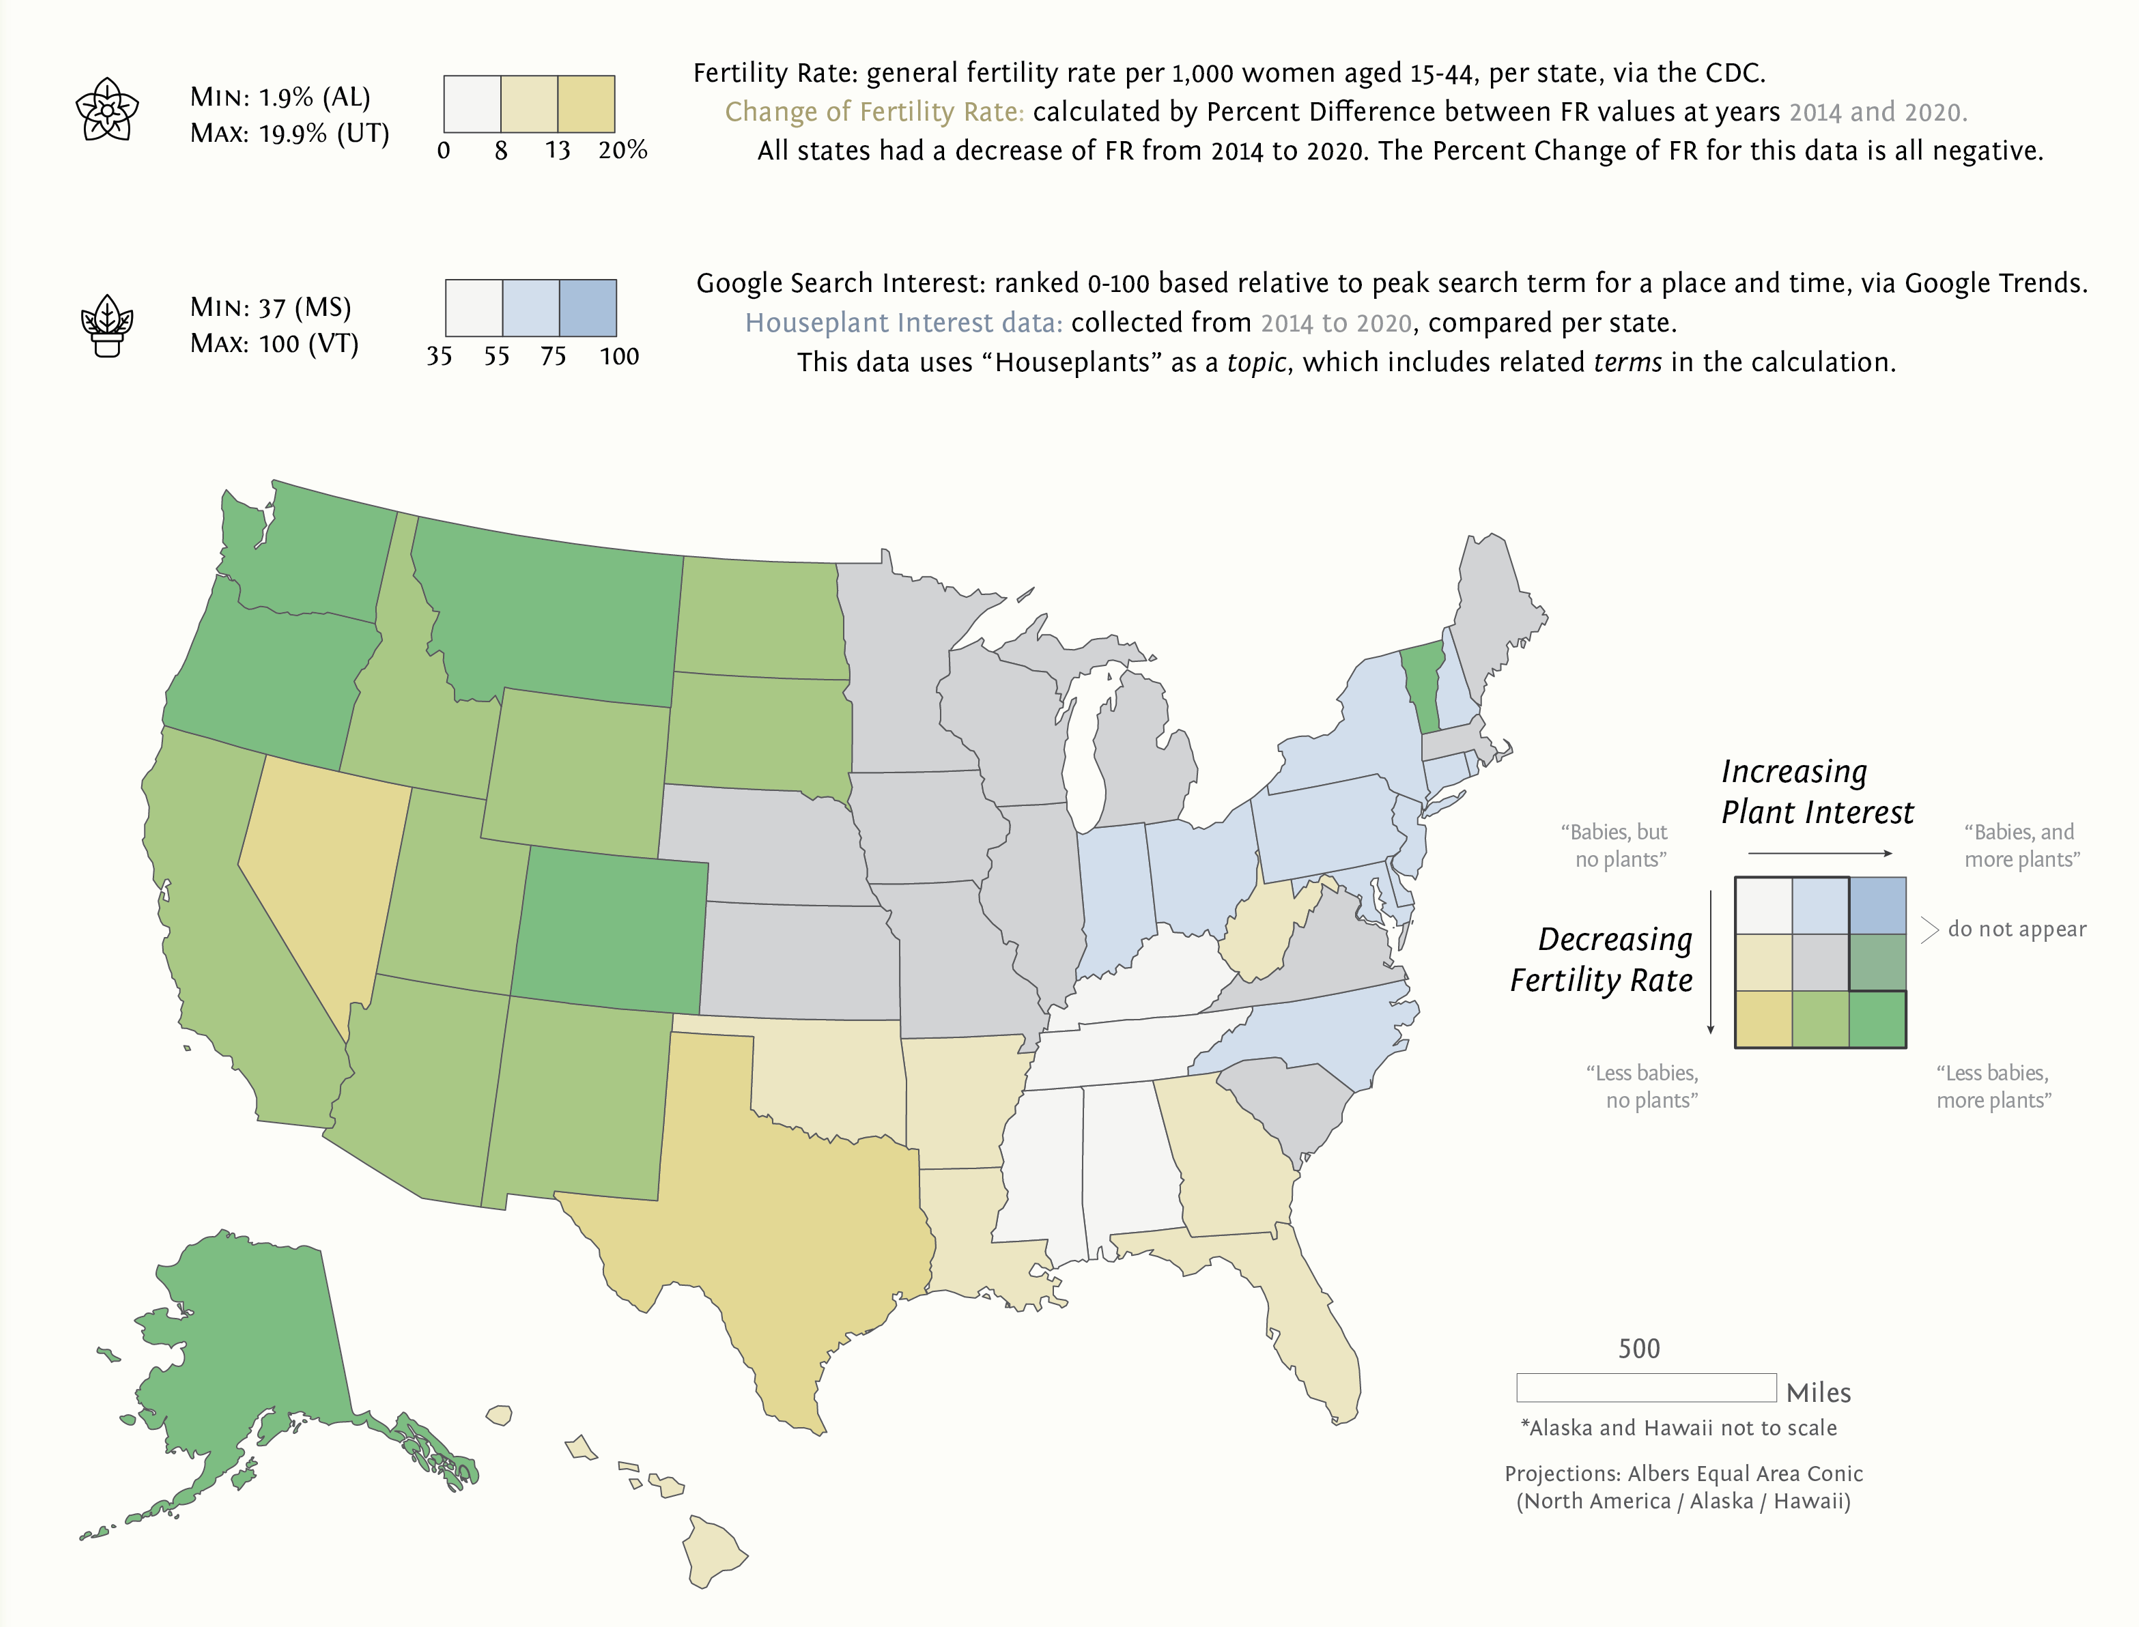
A graphical exploration of how related numbers of houseplants is to fertility rate in the USA. Mar 2023.
Great Dividing Range Cycling Race
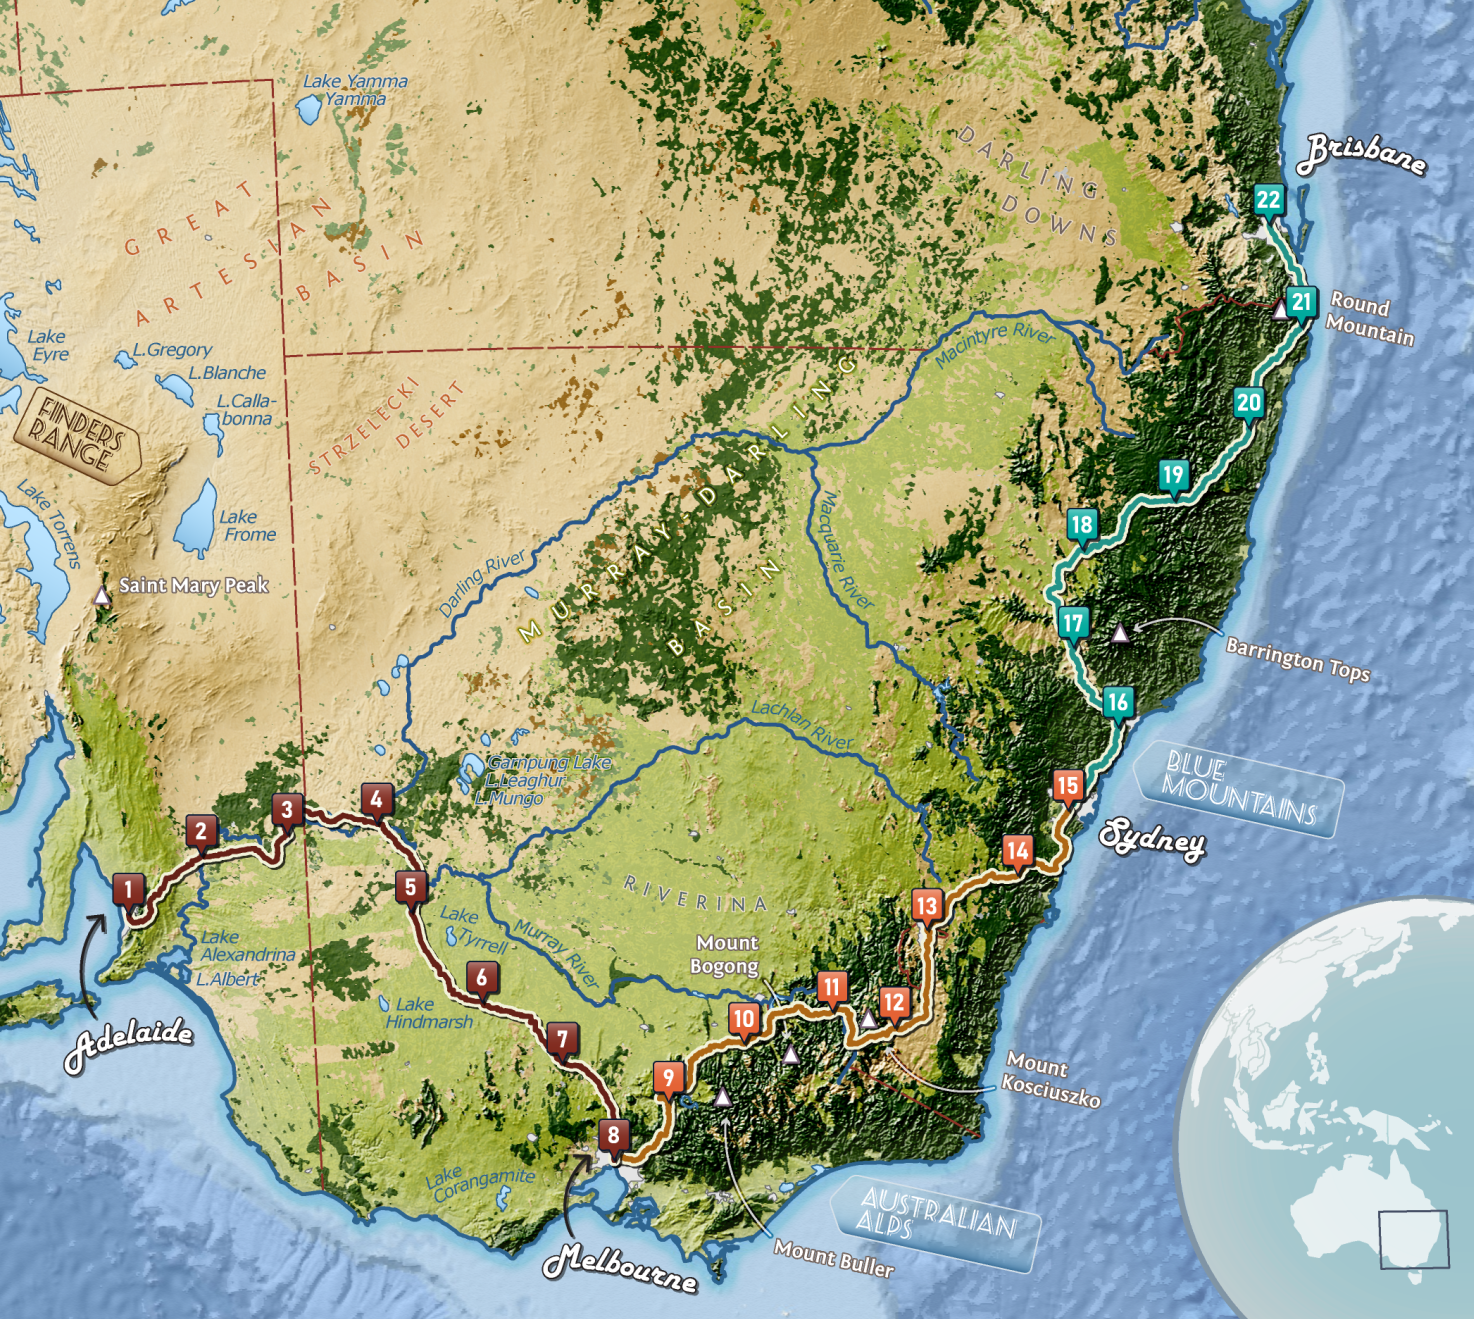
Learning raster processing, hillshades, and terrain coloration with a cycling race. Mar 2023.
Global Interest in Crochet
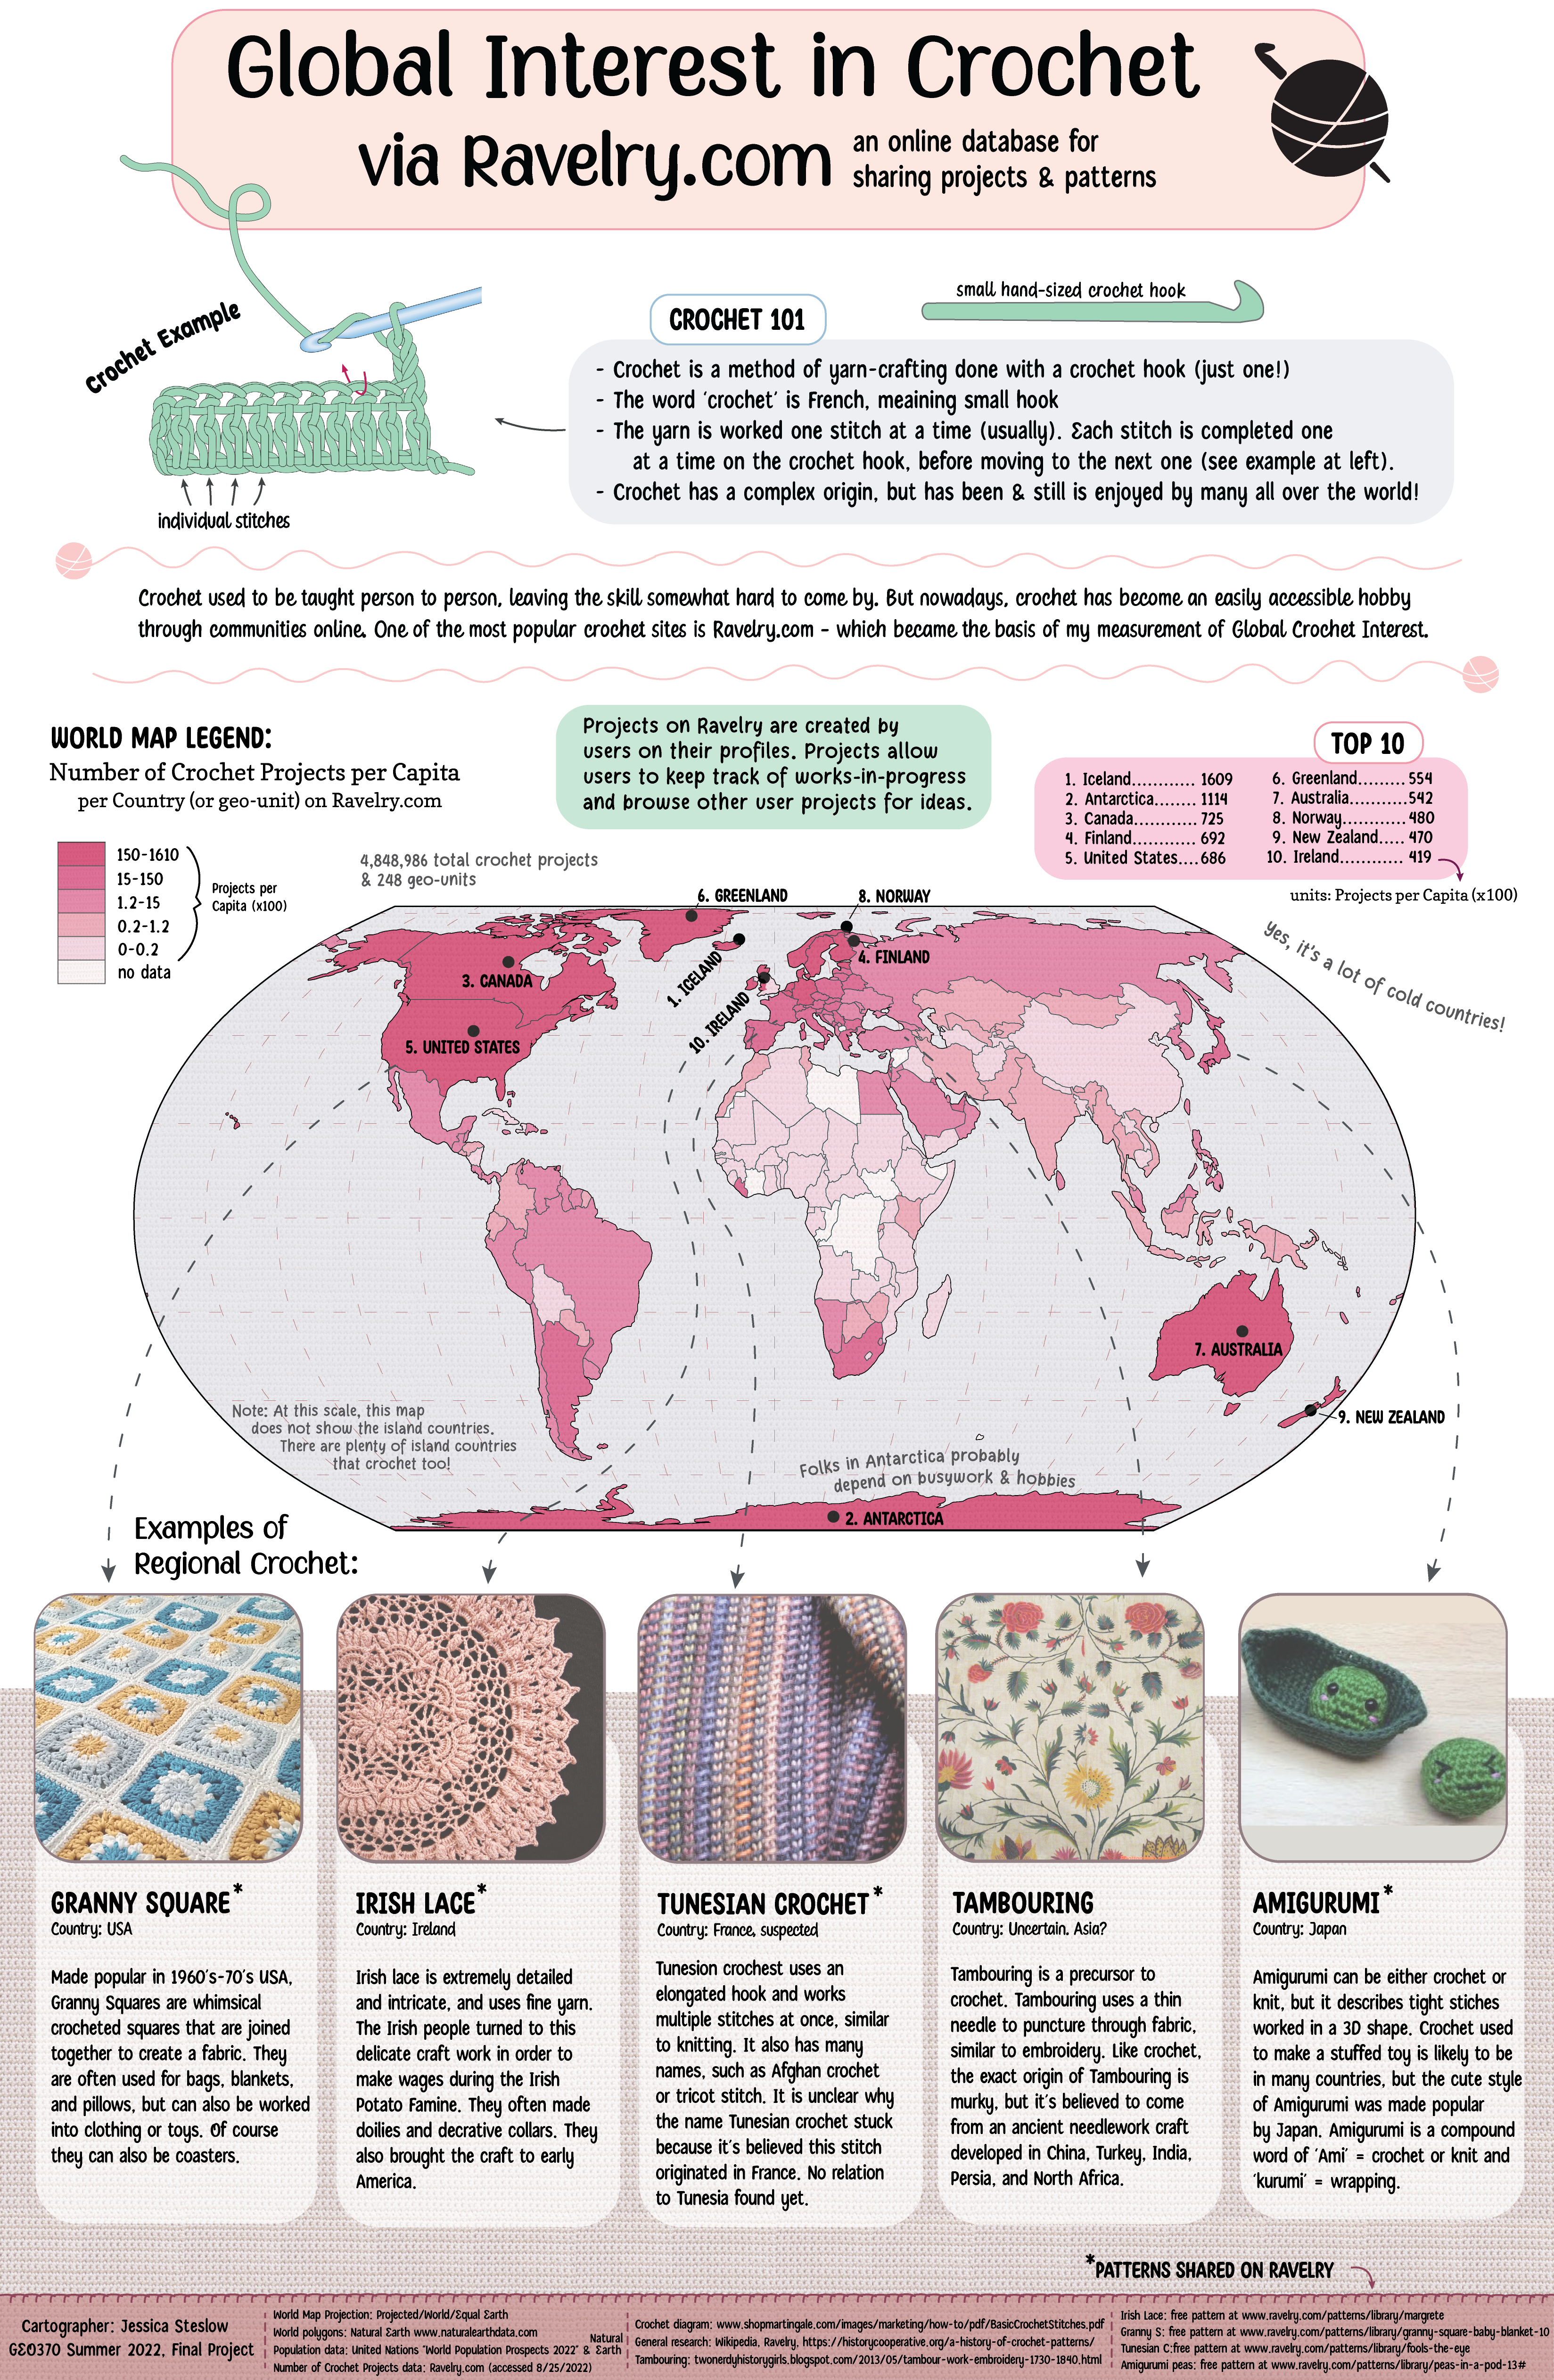
An infographic showing a map of the world with countries colored by the interest level in crochet, using data from Ravelry.com Sep 2022.
Sleep per USA County
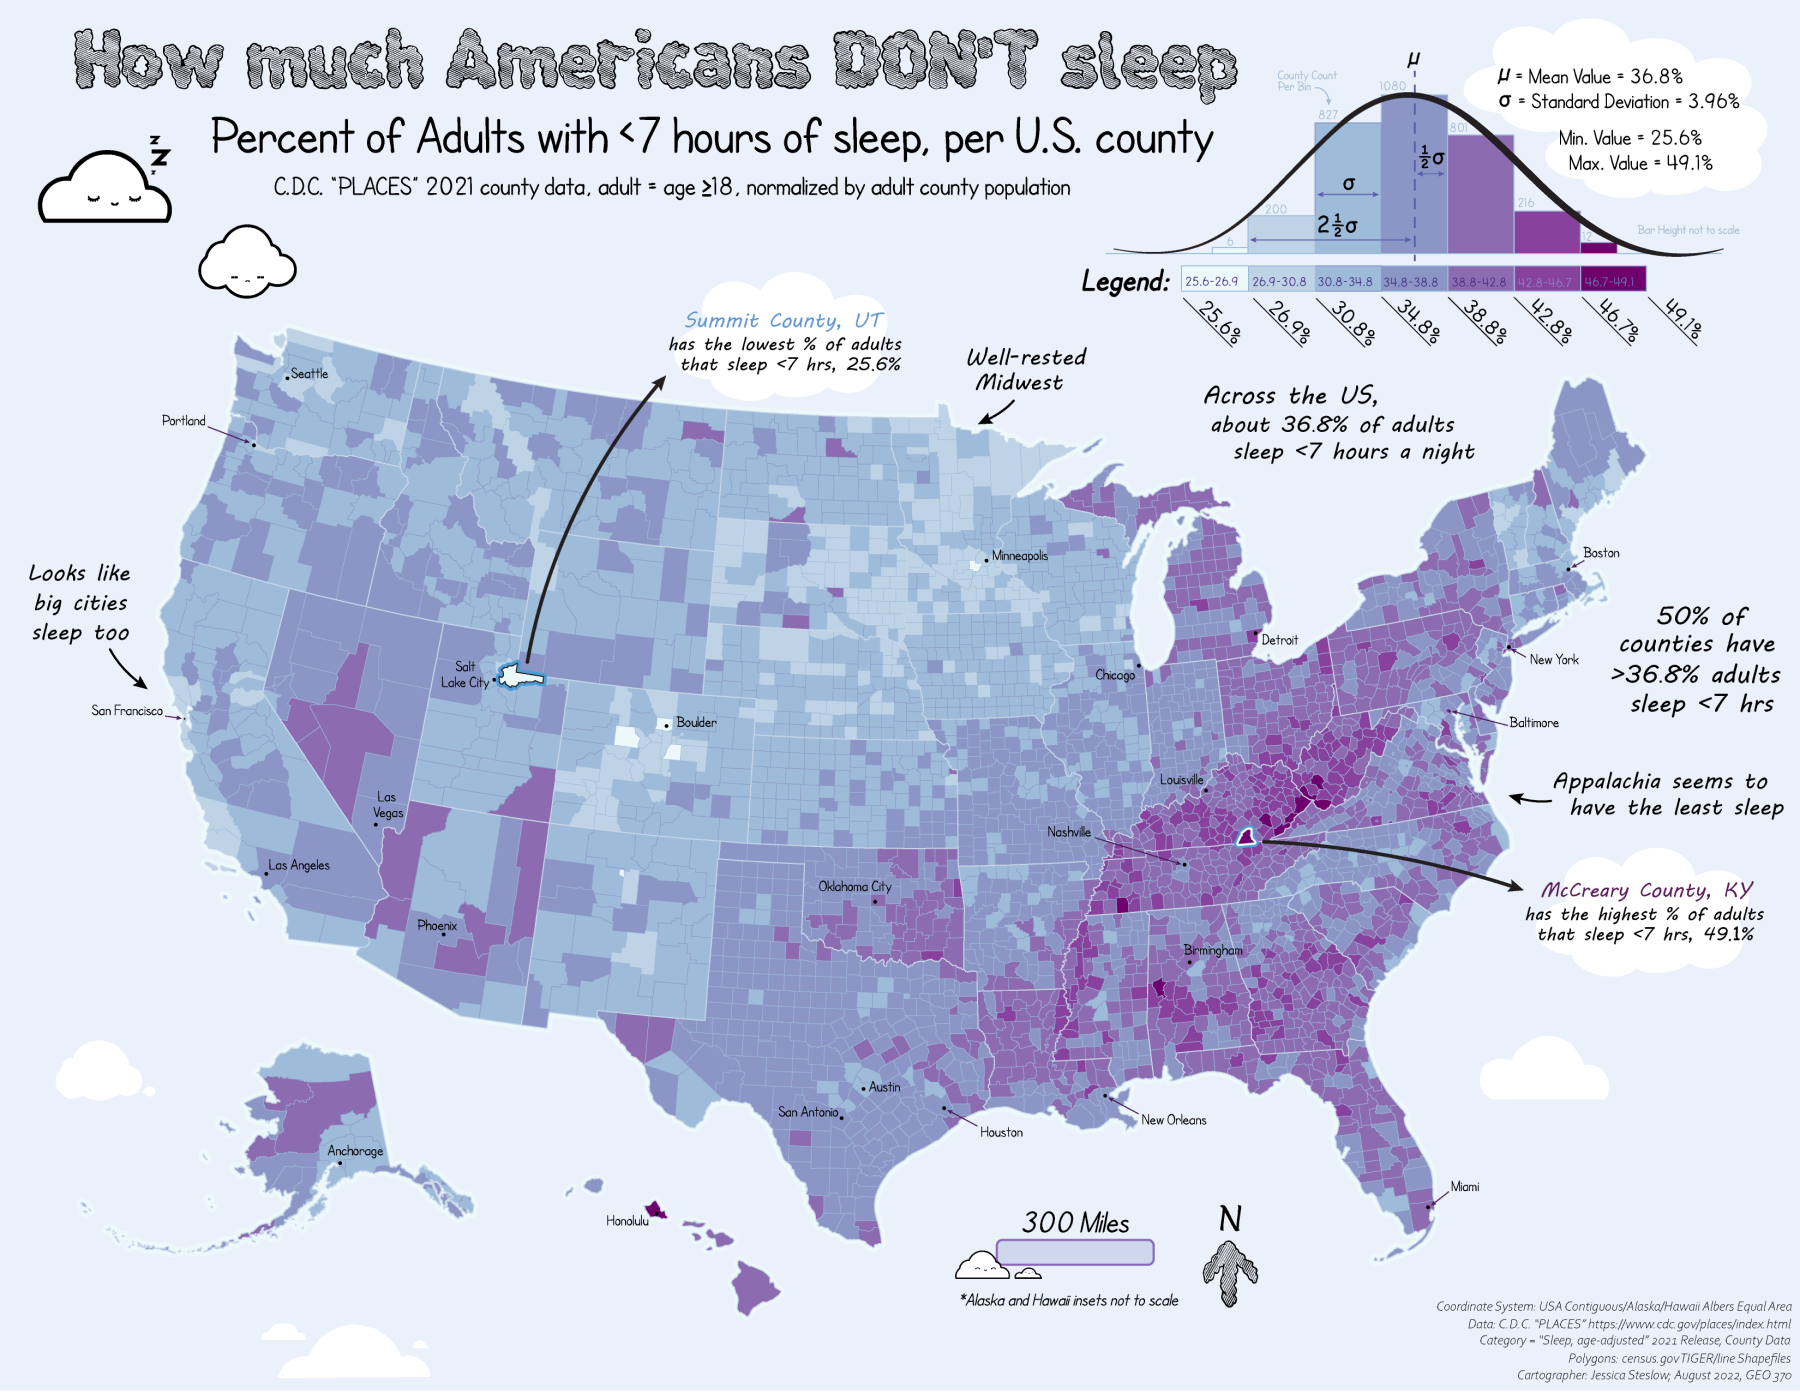
A choropleth map explorating how different counties in America sleep. Aug 2022.
Physical Map of Africa
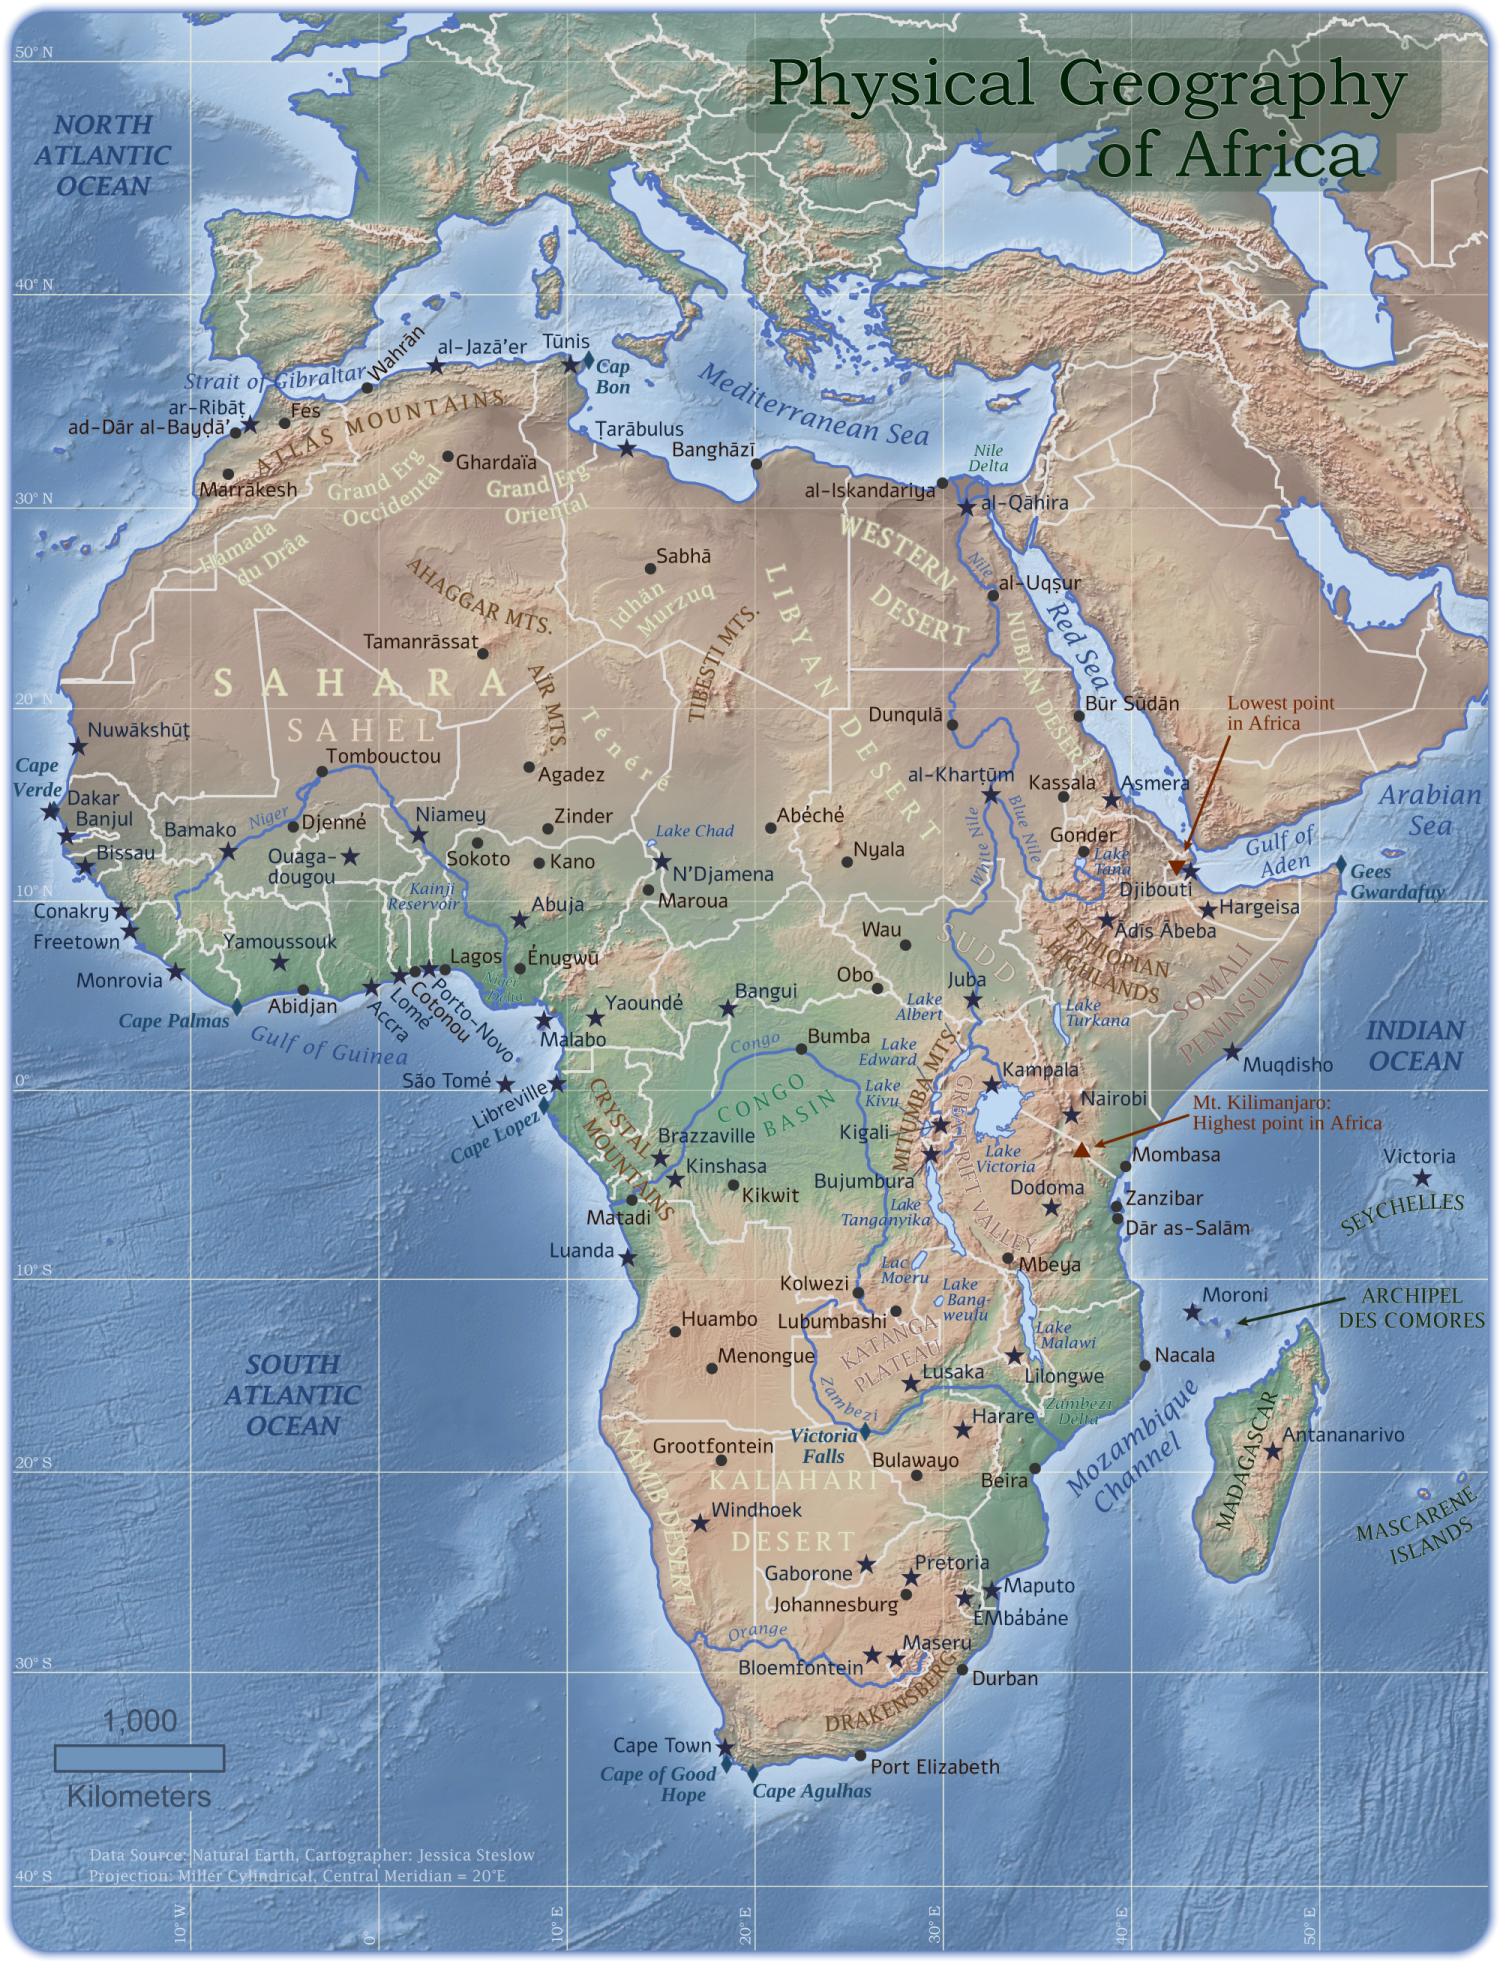
A physical map of Africa testing my ability to design labels in a tight squeeze. Jul 2022.
Arizona State Reference Map
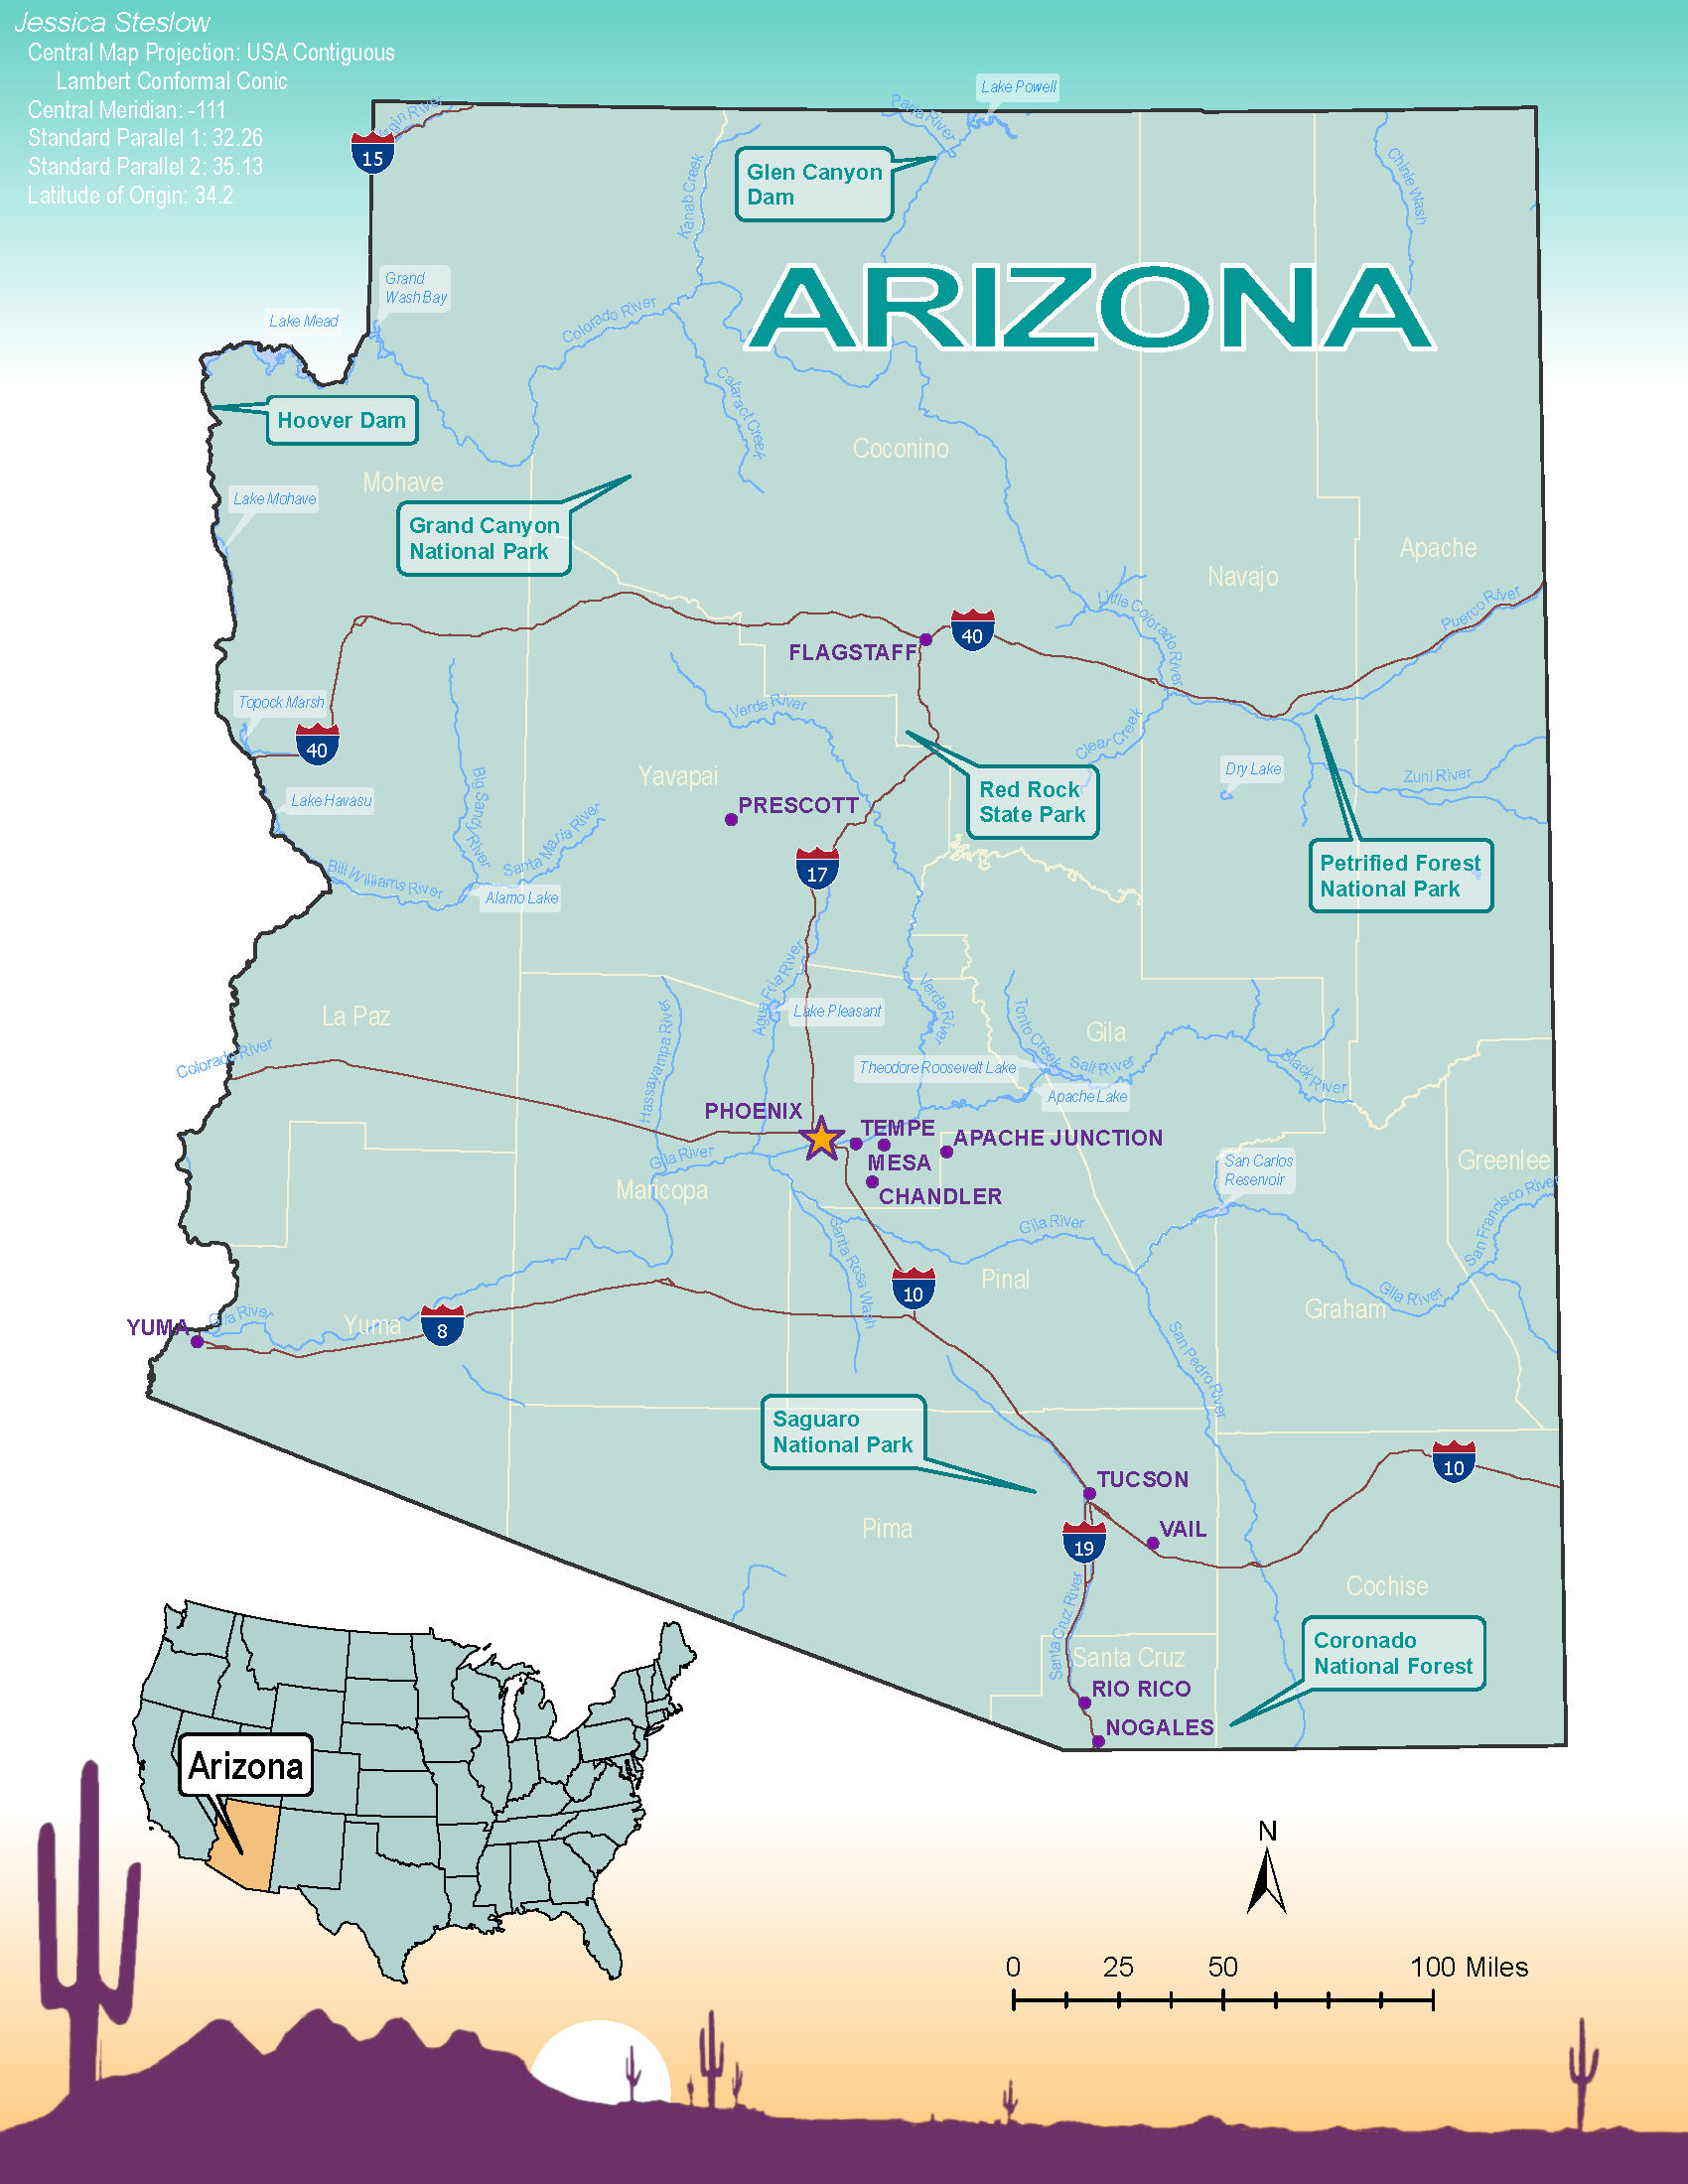
A reference map of the U.S. State of Arizona with labels for major roads and waterways. Jun 2022.