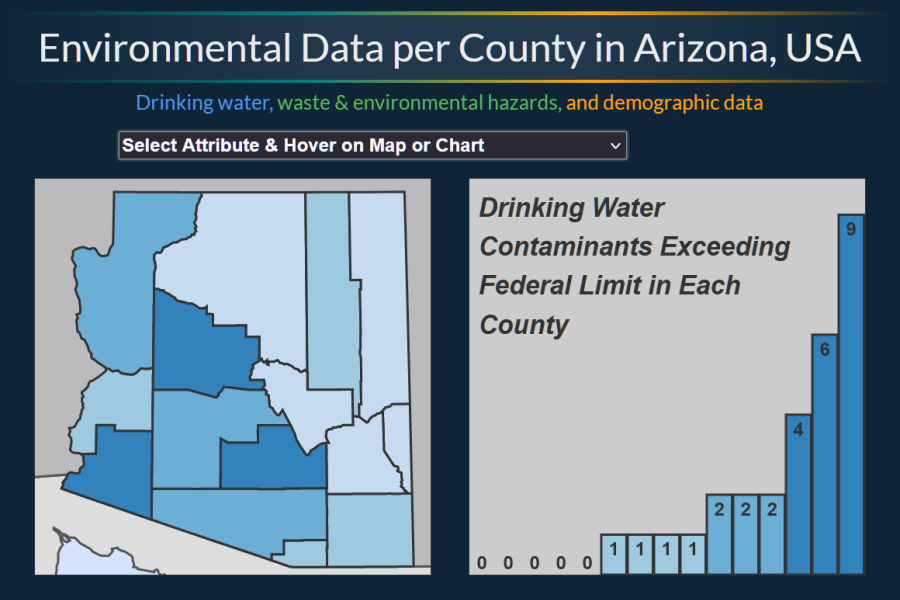
This project is for a lab in my UW-Madison Geog 575 Interactive Cartography Class. I learned more on front-end web design while also learning about D3. D3 has many exciting tools for data visualizations and I’d like to use it more.
The code is available on github, https://github.com/steslowj/geog575_az-data-d3.
Skills: JavaScript coding, Visual Studio Code, D3 coding, reading scientific data, gathering scientific data, data presentation, visualization, color design, front-end web design
