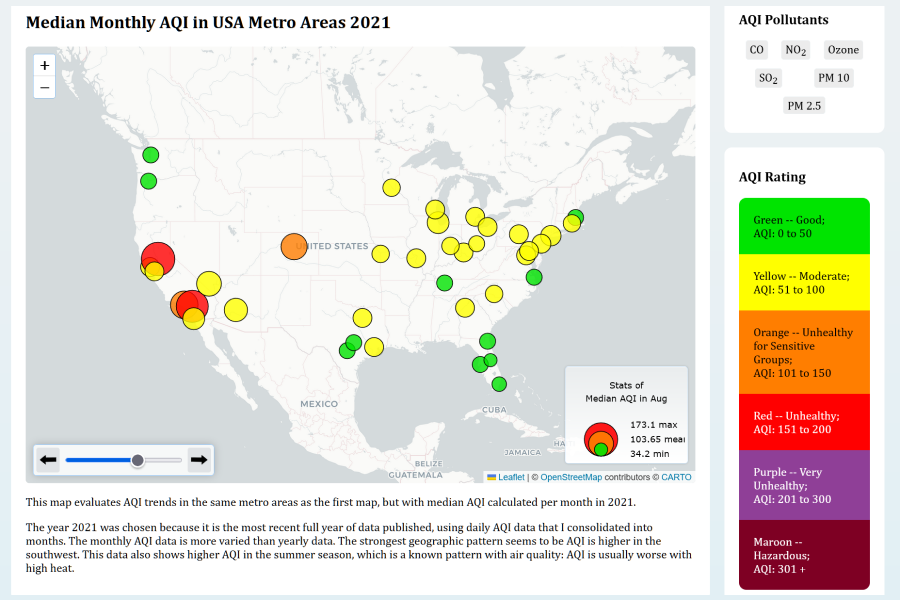
This project is my Lab 1 for UW-Madison Geog 575 Interactive Cartography Class. I wanted to explore air quality data but wasn’t sure which time scale would be best to show in the visualization… so I chose to do all three! The total effect having three different visualizations stacked on top of each other feels like a story map, exploring how a change in one parameter affects the data.
The code is available on github, https://github.com/steslowj/geog575_air-quality-leaflet.
Skills: JavaScript coding, Visual Studio Code, Leaflet coding, reading scientific data, gathering scientific data, data presentation, visualization, color design, front-end web design
