
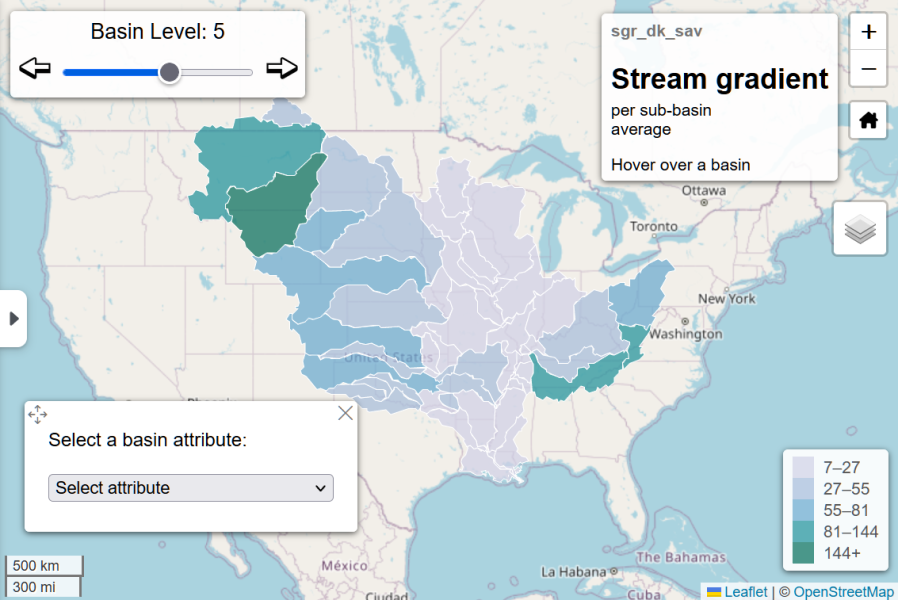
This project is my Final Project for my UW-Madison Geog 575 Interactive Cartography Class, created as a group project with my fellow student Jack Plasterer. I wanted to create this application to help myself explore the very large dataset that is HydroSHEDS, containing hundreds of environmental, social, and physical parameters of watersheds subdivisions at every subdividing level. I used Leaflet to display the data with choropleth coloration and I used D3 to create a data visualization.
I think the toggles between watersheds worked out excellently - it is so interesting to see how the data changes as the subdivision levels change as well. If I had more time, I would tweak how the graph displays data.
The code is available on github, https://github.com/steslowj/geog575_final-mississippi-hydrosheds.
Skills: JavaScript coding, Visual Studio Code, Leaflet coding, D3 coding, working with large datasets, data presentation, visualization, color design, front-end web design, working in a team